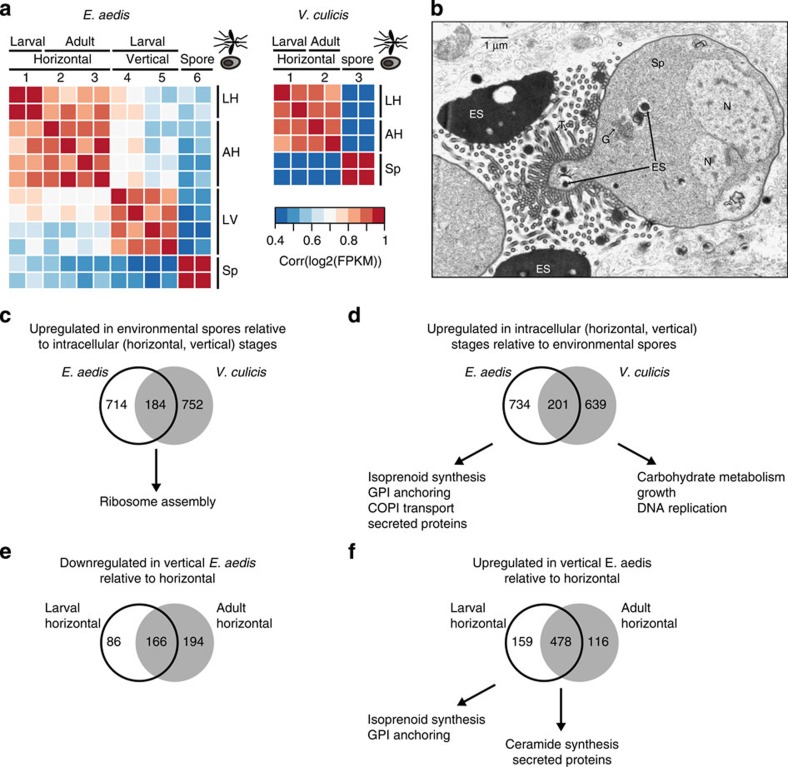
Figure 3. Transcriptional signatures of E. aedis and V. culicis life cycles.
(a) Pairwise correlation coefficients of transcript abundances between samples of E. aedis and V. culicis. Coefficients were calculated from log2-transformed FPKM values. Numbers correspond to time points in Fig. 1d,e, and the position of the sample in both the microsporidian and mosquito lifecycle is shown on the x axis. Letter codes on the y axis correspond to labels on the x axis: LH: larval horizontal; AH: adult horizontal; LV: larval vertical; Sp: environmental spores. (b) Transmission electron micrograph of a diplokaryotic sporont (Sp) of E. aedis in the vertically transmitted portion of the life cycle. Electron-dense secretions (ES) in the cytoplasm are transported into the episporontal lumen via tubules (T) where they accumulate. G (Golgi bodies); N (Nucleus). (c–f) Venn diagrams of differentially expressed genes (q<0.05), with enriched functional classes (c) upregulated in environmental spores of E. aedis and V. culicis relative to intracellular stages; (d) upregulated in intracellular stages of E. aedis and V. culicis relative to environmental spores; (e) downregulated in the vertically transmitted portion of the E. aedis life cycle relative to the horizontally transmitted portion; (f) upregulated in the vertically transmitted portion of the E. aedis life cycle relative to the horizontally transmitted portion.

