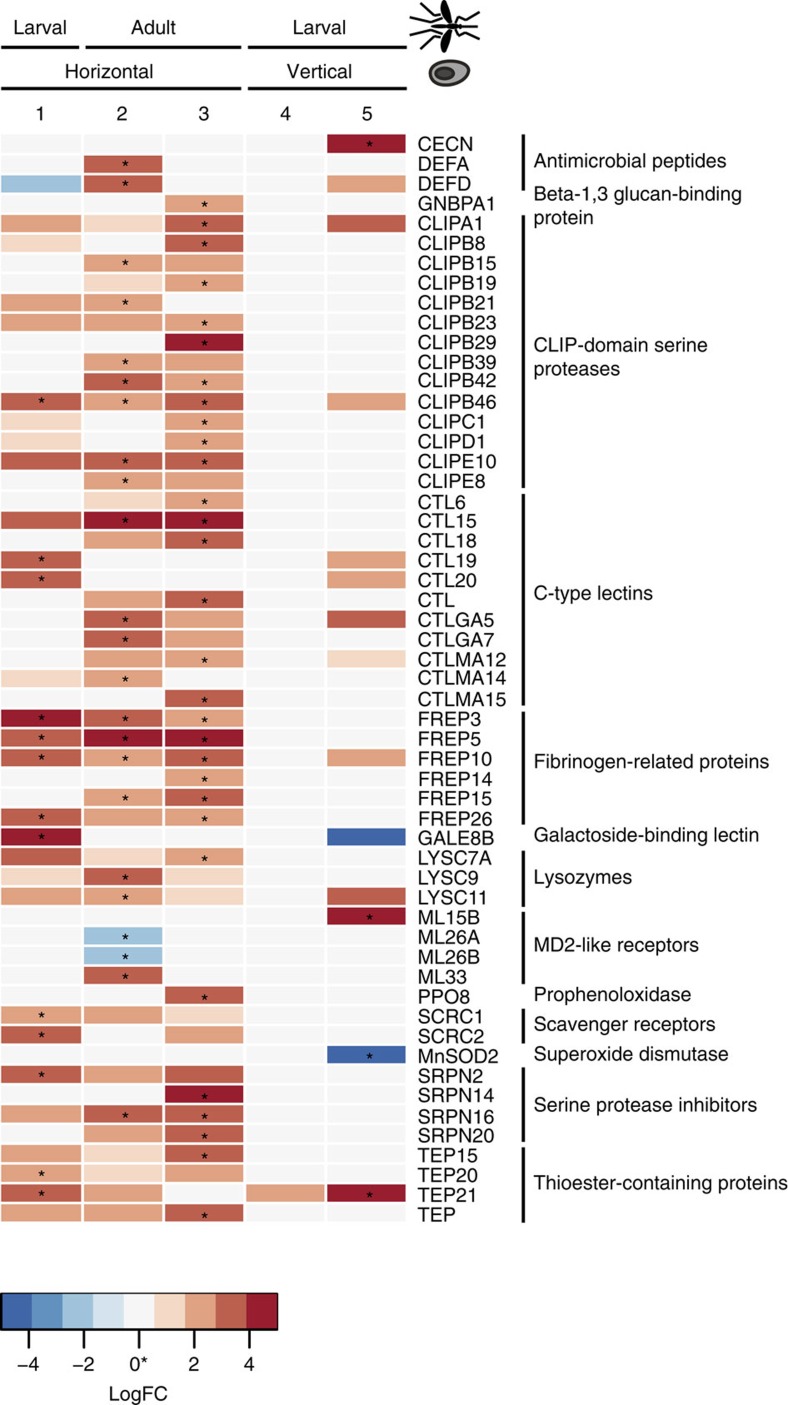
Figure 4. Differentially expressed immunity genes in infected Ae. aegypti.
Boxes marked with asterisks represent genes that were significantly differentially expressed at q<0.05; coloured boxes represent genes that were differentially expressed at P<0.05. Red boxes represent genes upregulated during infection, while blue boxes represent genes downregulated during infection. Numbers correspond to time points in Fig. 1b, and the position of the sample in both the microsporidian and mosquito lifecycle is shown on the x axis.

