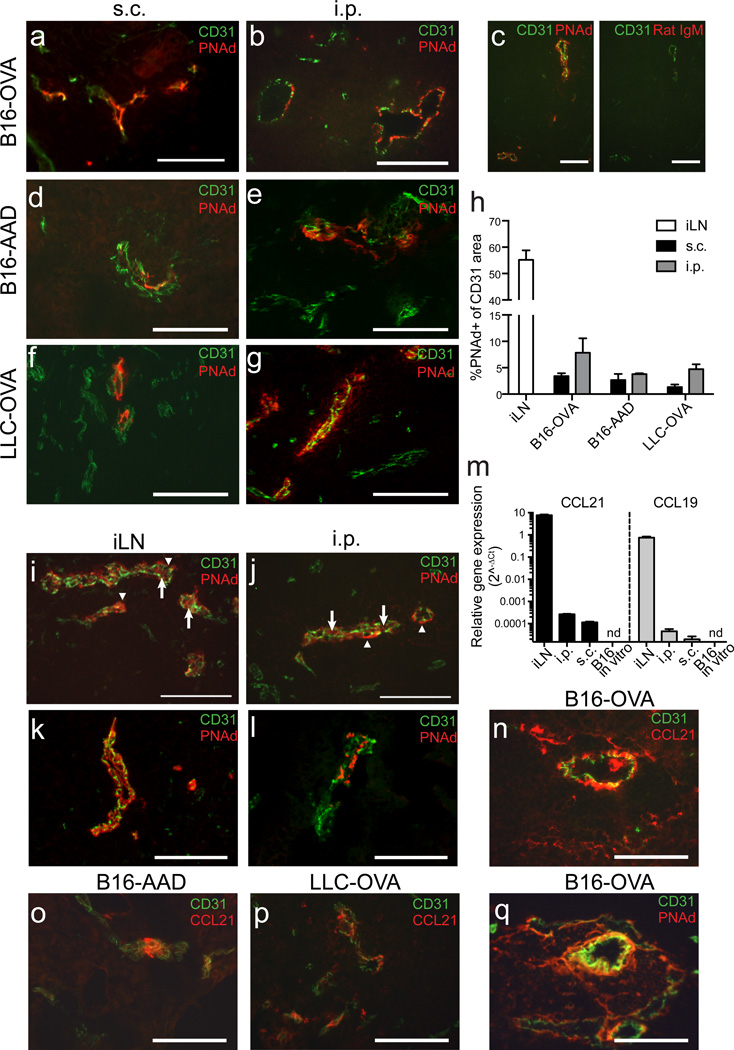
Figure 1. Tumors spontaneously develop LN-like vasculature expressing PNAd and CCL21.
(a–g) Frozen sections of d 14 B16-OVA tumors (a–c), B16-AAD tumors (d–e), or LLC-OVA tumors (f–g) growing s.c. (a,d,f) and i.p. (b,c,e,g) in C57BL/6 mice were stained for CD31 and PNAd. In (c) two adjacent sections were stained for CD31 and with either PNAd or Rat IgM isotype control antibody.
(h) The percentage of CD31+ area expressing PNAd in each tissue was quantified as described in Methods. iLN is inguinal LN. Bars represent mean+SEM. n=4 per tissue.
(i–l) PNAd staining on HEV in inguinal LN (i,k) and i.p. B16-OVA tumors (j,l). In (i,j) arrows mark luminal PNAd, arrowheads mark abluminal PNAd. In (k,l) luminal PNAd was detected with streptavidin after i.v. injection of biotinylated MECA-79 antibody 30 m prior to harvest.
(m) Expression of Ccl21, Ccl19 and Hprt mRNA in in vitro B16-cOVA cultures, and lysates (n=3) of s.c. and i.p. B16-cOVA tumors and inguinal LN was detected using 40-cycle RT-PCR. Relative gene expression is presented as 2^−ΔCT relative to HPRT.
(n–q) Sections of i.p. B16-OVA tumors (n,q), B16-AAD tumors (o), or LLC-OVA tumors (p) were stained for CD31 and either CCL21 (n–p) or PNAd (q). Two adjacent sections are shown in (n) and (q).
All images are representative of at least 3 independent experiments. Scale bars = 100 µm

