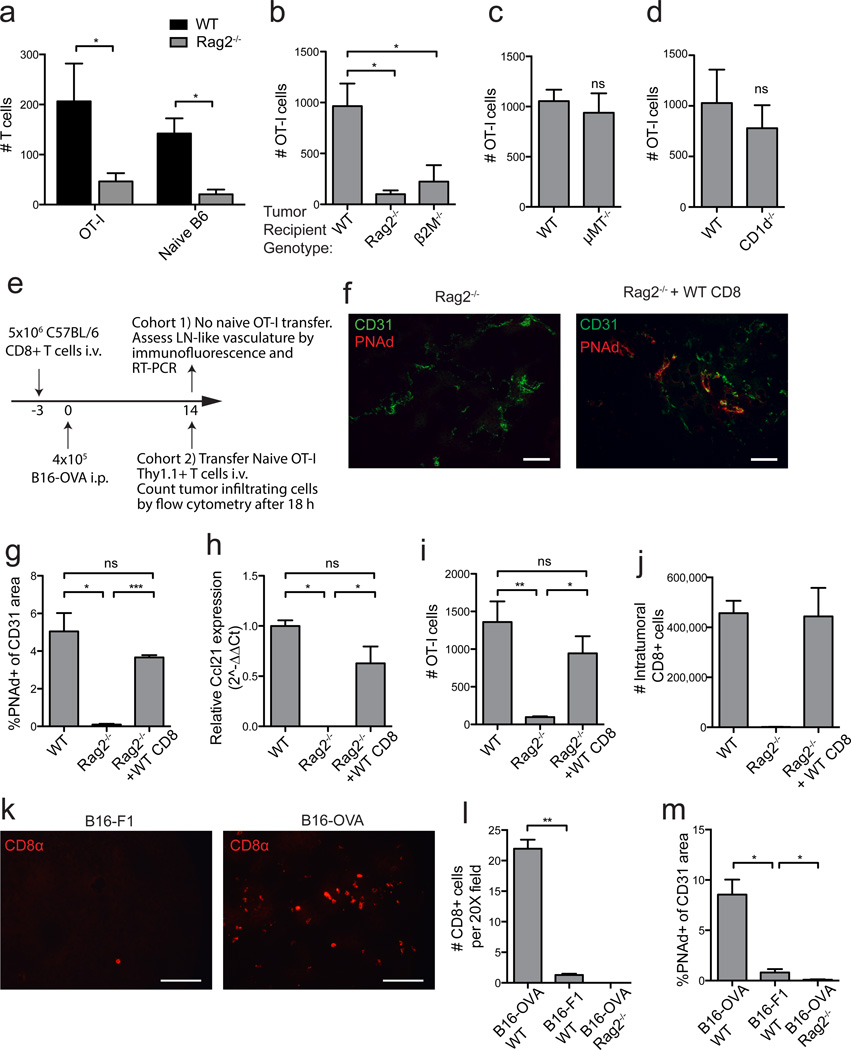
Figure 4. Endogenous CD8 T-cells induce LN-like vasculature in i.p. tumors.
(a) Infiltration of naïve Thy1.1+ OT-I cells and CD44lo naïve polyclonal T-cells purified from C57BL/6 and co-transferred into WT or Rag2−/− mice with established i.p. B16-OVA tumors was determined after 18 h by flow cytometry. n=3 per genotype.
(b–d) Infiltration of naïve OT-I cells into i.p. B16-OVA tumors in the indicated mice was determined. n=3 (b) or 5 (c–d).
(e) Experimental protocol used for the repletion of Rag2−/− mice with CD8 T-cells prior to tumor implantation. On d 14 after tumor implantation, tumors from one cohort of mice were harvested for immunofluorescence and RT-PCR. A second cohort of mice received naïve OT-I cells and tumors were processed for flow cytometry to assess infiltration into tumors.
(f,g) Representative images (f) and summary data (g, n=3–4) for PNAd expression in tumors in the indicated mice.
(h) Ccl21 expression (n=2) in i.p. tumor lysates was quantified as in Figure 3.
(i) Infiltration of naïve OT-I cells into i.p. B16-OVA tumors in the indicated mice was determined. n=3–5 per group.
(j) The absolute number of endogenous (non-OT-I) CD8+ T-cells that had accumulated in d 14 i.p. B16-OVA tumors in mice with the indicated background was determined by flow cytometry.
(k,l) Representative images (k) and summary data (l, n=2) for endogenous CD8 T-cell accumulation in d 14 B16-F1 or B16-OVA tumors growing in WT mice determined by immunofluorescence.
(m) Expression of PNAd in either B16-F1 or B16-OVA tumors growing in the indicated mice. n=4 per group.
Data (mean+SEM) are representative of at least two independent experiments. ns:p>0.05, *p<0.05, **p<0.01, ***p<0.001 by unpaired t-test (a,c,d) or one way ANOVA with Tukey’s post-test (b,g-m).

