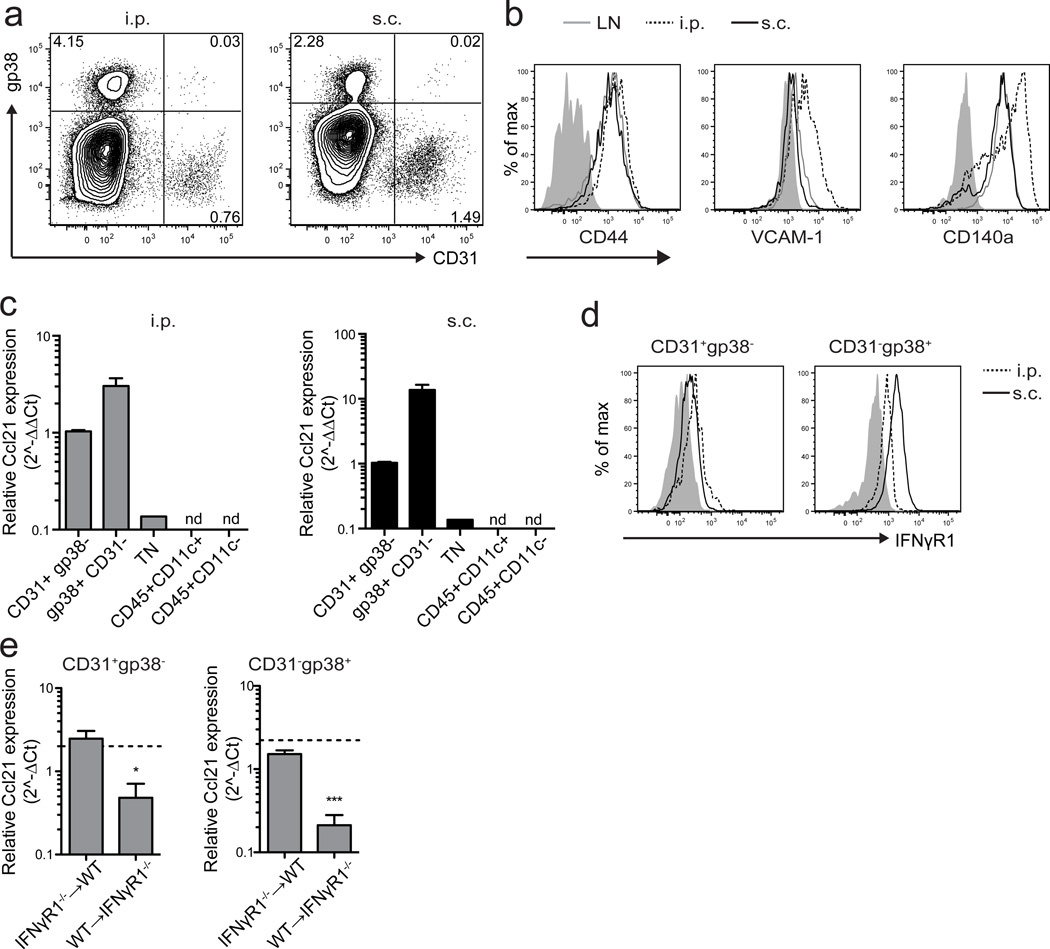
Figure 7. IFNγ controls CCL21 expression by endothelial cells and gp38+ cells.
(a) Frequency of gp38+ and CD31+ cells among live singlet Ter119negCD45neg cells from i.p. and s.c. tumors was determined by flow cytometry.
(b) The phenotype of gp38+ cells from LN (solid gray lines), s.c. (solid black lines) and i.p. (dotted lines) B16-OVA tumors was determined by flow cytometry by staining with the indicated markers. The parent gate is live singlet CD45neg gp38+ CD31neg. Shaded regions represent background staining in FMO controls.
(c) Ccl21 expression in the indicated purified cell populations from i.p. and s.c. tumors was measured by RT-PCR. Expression levels in CD31+ endothelial cells for each tumor location were normalized to 1. TN = CD45neg gp38neg CD31neg. n=3. nd=not detected.
(d) IFNγR1 expression on CD31+ and gp38+ cells from i.p. (dashed lines) and s.c. (solid lines) tumors was determined by flow cytometry. Shaded regions represent background staining in FMO controls.
(e) Ccl21 expression in purified cell populations isolated from i.p. tumors in IFNγR1−/−➔WT and WT➔IFNγR1−/− bone marrow chimeras was measured by RT-PCR. Expression levels are presented relative to Hprt. Dashed lines represent expression levels in WT➔WT control chimera. n=4 per group.
Data (mean+SEM) are representative of three (a–d) independent experiments or one experiment (e). ns:p>0.05, *p<0.05, ***p<0.001 by unpaired t-test.

