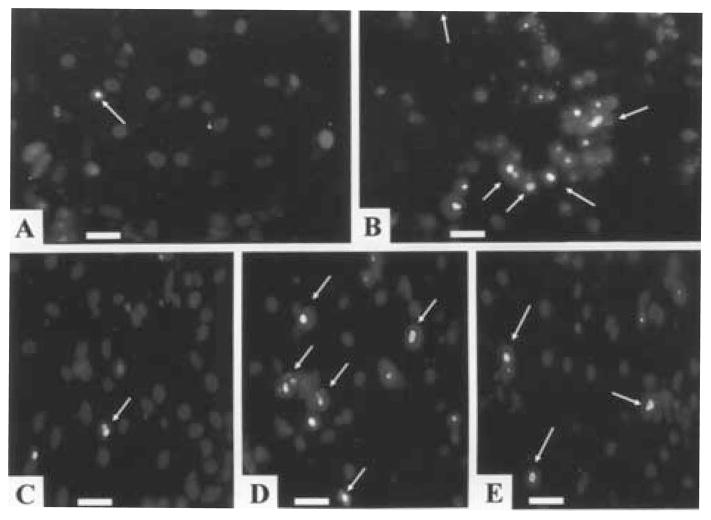
Fig. 3.
Hoechst staining. (A) Control cells. (B) After exposure of myocytes to Ang II (10 nmol/L) for 24 h. (C) Pretreatment with CCPA (1 μmol/L) before Ang II. (D) Ang II treated cells, exposed to CPX (1 μmol/L) before pretreatment with CCPA (1 μmol/L). (E) Pretreatment with IB-MECA (0.1 μmol/L) before Ang II. Arrows indicate apoptotic cardiomyocytes. Bars = 10 μm.

