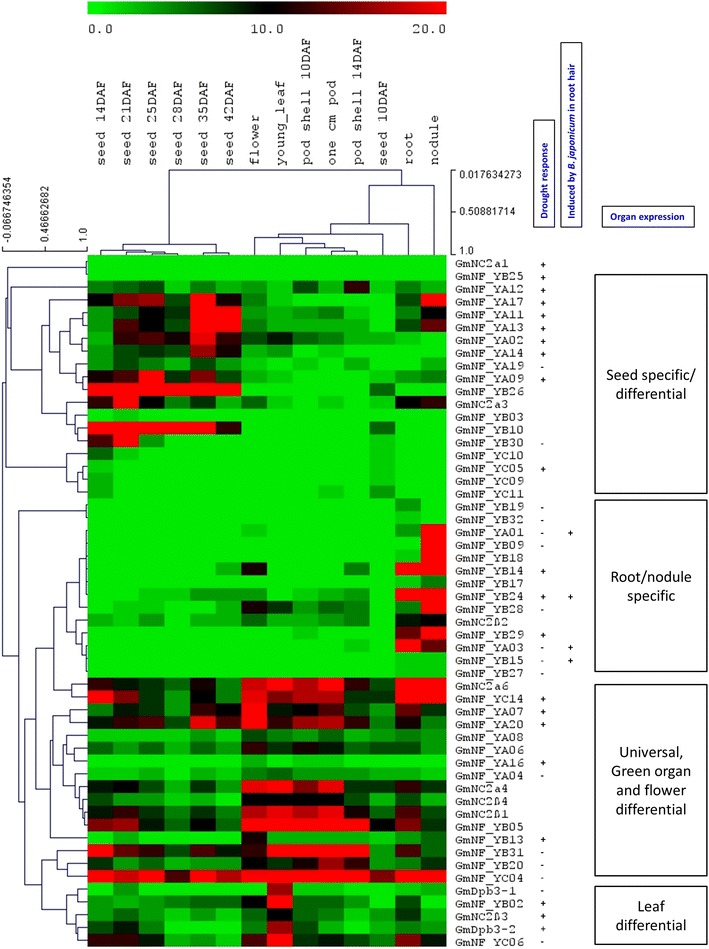
Fig. 1.

Expression of soybean NF-Y in various tissues, drought stress and rhizobium inoculation. Data of 54 GmNF-Y genes were retrieved from the normalized RNA sequencing databases (Libault et al. 2010; Severin et al. 2010) for clustering analysis of tissue-specific and stress-response expression. For drought and rhizobium treatments (+) and (–) indicate up and down gene expression in both root and leaf tissues tested, compared to non-stress condition. The color bar represents number of RPKM (color figure online)
