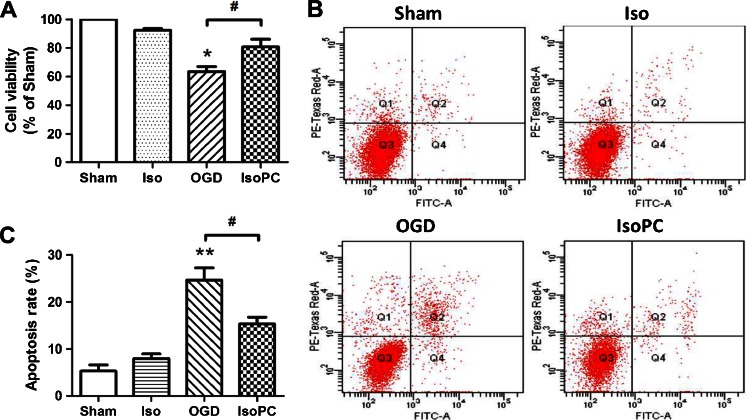
Fig. 1.
a Cell viabilities indicated by the MTT values in each experimental group. The values in vertical axis indicate the percentage of cells in each group compared to the sham (n = 6 for each group). Data are presented as mean ± SEM. *p < 0.05 compared with the sham group. #p < 0.05 compared with the OGD group. b, c Anti-apoptotic effects of isoflurane preconditioning in cells subjected to OGD as indicated using Annexin V-FITC double staining and flow cytometry

