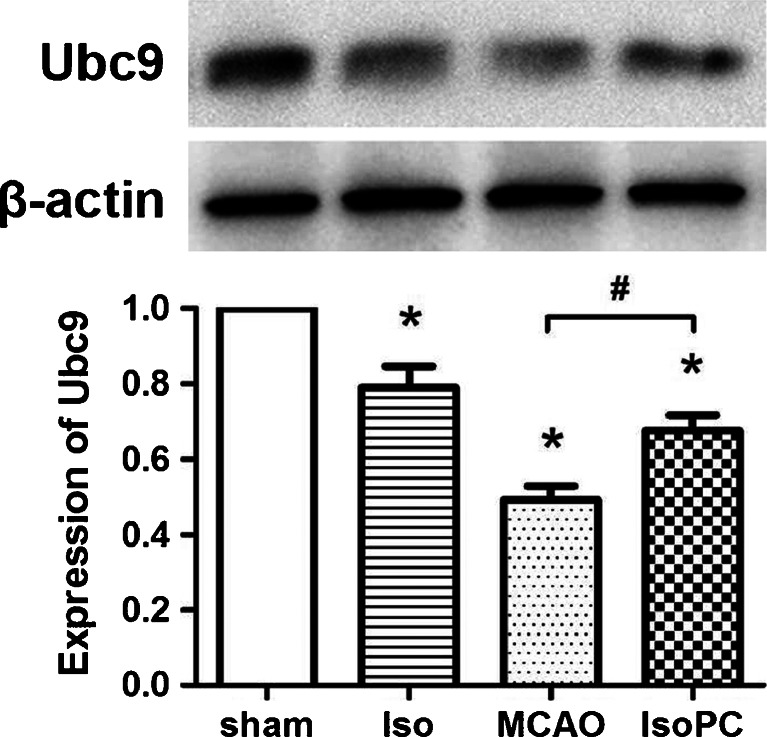
Fig. 5.
Western blot analysis for relative protein expression rate of Ubc9/β-actin in Sham, Iso, MCAO, and IsoPC (isoflurane preconditioning plus MCAO) groups 4 h after reperfusion. The upper part is the photo of representative Ubc9 and corresponding β-actin blotting bands. The lower part is the histograms showing the results of densitometric analysis (n = 6 for each group). Data are presented as mean ± SEM. *p < 0.05 compared with the sham group. #p < 0.05 compared with the MCAO group

