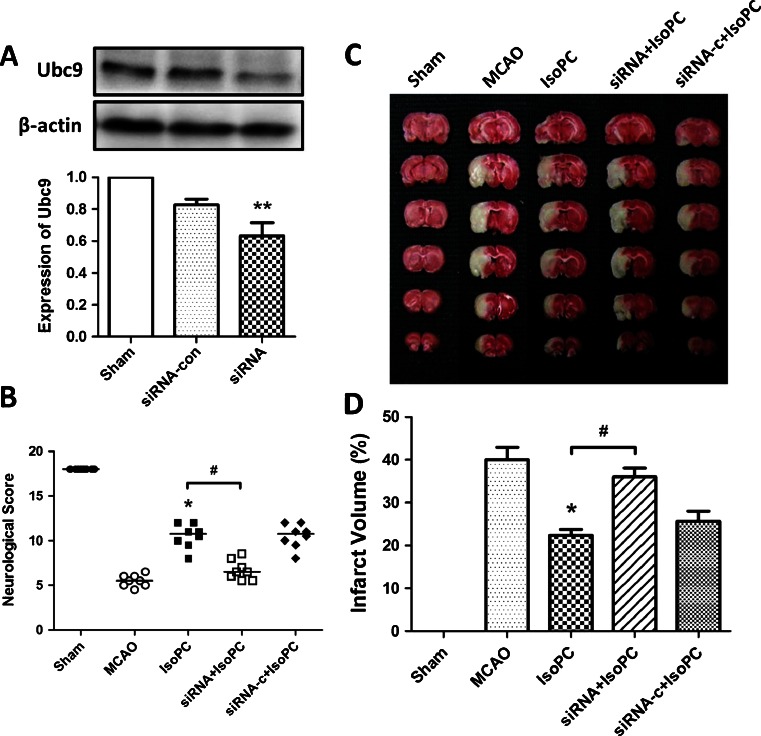
Fig. 6.
a Western blot analysis showed the relative expression rate of Ubc9/β-actin in rats. The rats were divided into three groups: sham, untreated rats; siRNA, rats injected with Ubc9 siRNA; siRNA-c, rats treated with Allstars Negative Control siRNA. Data are presented as mean ± SEM. **p < 0.01 vs. sham group. b The effect of Ubc9 siRNA on neurobehavioral manifestations. Each circle represents the score for a single rat. The horizontal bar indicates the mean value for each group. *p < 0.05 vs. MCAO group. #p < 0.05 vs. IsoPC group. c Comparisons of percentages of infarct volume among the five groups. *p < .05 vs. MCAO group. #p < 0.05 vs. IsoPC group

