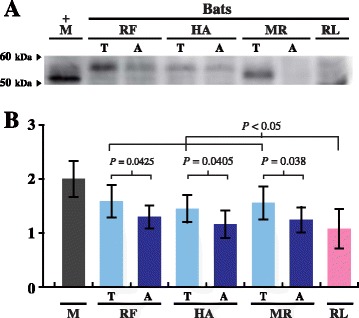
Fig. 3.

Expression levels of PPARα in bats determined by Western blotting. (A) Western blotting results of PPARα. (B) Relative levels of PPARα. The expression level of the PPARα protein in mice (M) was set as 2, and that of PPARα in each bat species was relative to it. RF, HA, and MR represent hibernating R. ferrumequinum, H. armiger, and M. ricketti bats, respectively. RL represents non-hibernating R. leschenaultii bats. T and A indicate bats in torpid and active states, respectively. Arrowheads in (A) indicate molecular weights (kDa) of protein markers. Relative levels of the PPARα protein in mice (gray), torpid (light blue) and active (dark blue) bats, and non-hibernating bats (pink) are shown in (B). Results are presented as mean ± SD. A P value < 0.05 is considered significant
