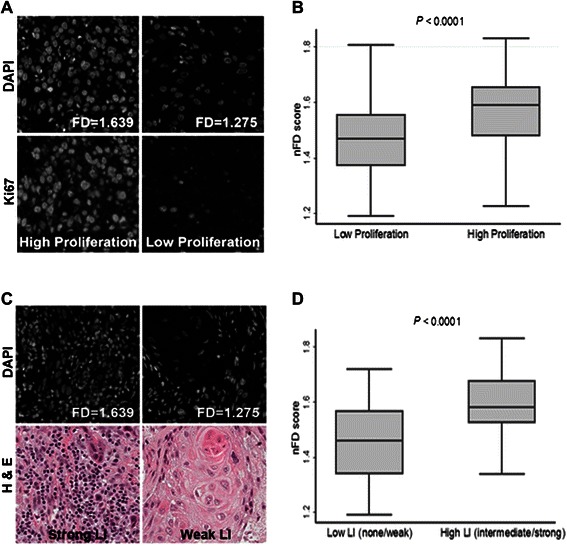
Figure 3.

Association between nuclear fractal dimension (nFD) and features of the tumor microenvironment. (A) Representative DAPI-stained images of TMA cores with high and low nFD (upper panels) and images of the same cores stained for Ki67 (lower panels). (B) Box and whisker plot showing the association between nFD and tumor proliferation. (C) Representative DAPI-stained images of TMA cores with high and low nFD (upper panels) and H & E-stained images of cores from the same patient that were used for assessing lymphocytic infiltration (LI; lower panels). (D) Box and whisker plot showing the association between nFD and LI.
