Figure 1.

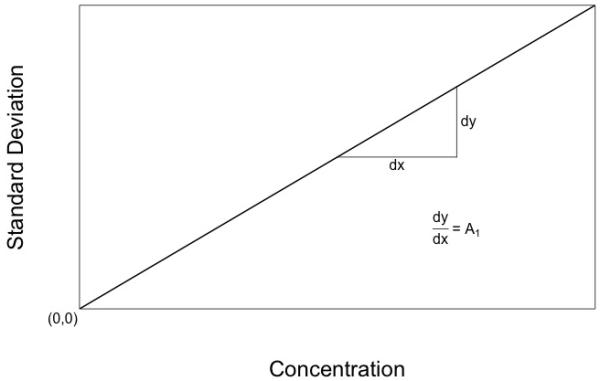
Diagram of an ideal assay with a constant CV%. The assay SD gets smaller and smaller as the measurement approaches zero, and ideally is zero when the measurement is zero.

Diagram of an ideal assay with a constant CV%. The assay SD gets smaller and smaller as the measurement approaches zero, and ideally is zero when the measurement is zero.