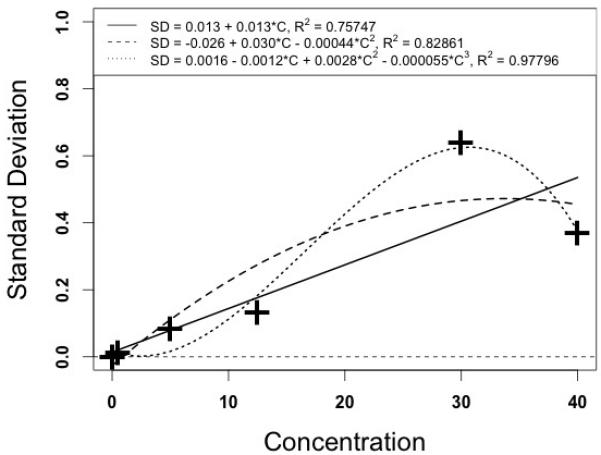
Figure 5.

Plot of Voriconazole measured concentrations (horizontal), and assay standard deviation (vertical). The solid line represents the graph of the first degree polynomial, the dashed line the second degree polynomial, and the dotted line the third degree polynomial.
