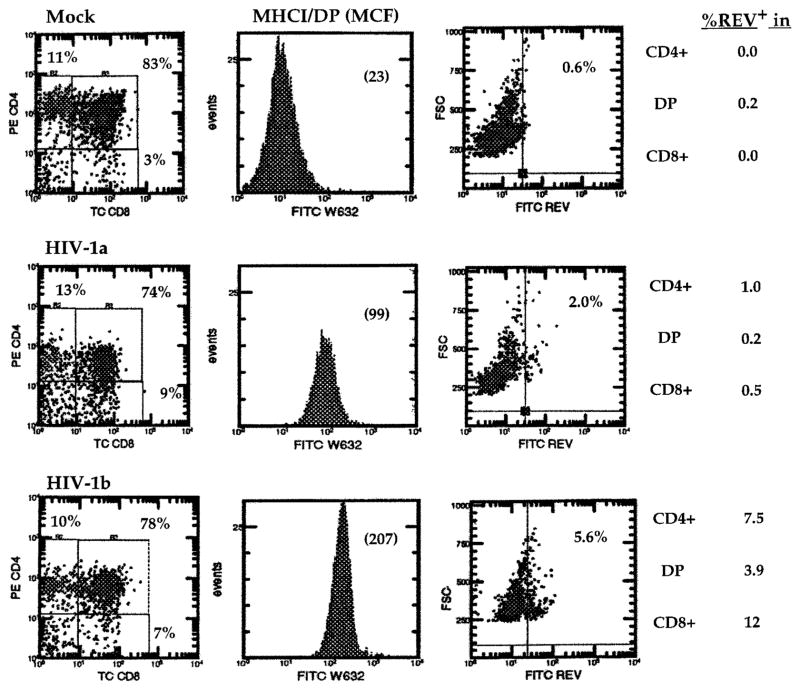
FIGURE 3.
Induction of MHCI expression in HIV-1-infected HF-TOC assays. HF-TOC were infected with mock or HIV-1 (NL4-3) supernatant and analyzed at 7 dpi. Two representative HIV-1-infected HF-TOC samples were shown (HIV-1a and HIV-1b). MHCI expression on DP thymocytes is shown as the mean channel fluorescence (MCF) in parentheses. The histogram on the right shows cells expressing intracellular HIV-1 Rev detected by a separate FACS analysis (Rev-FITC/CD4-PE/CD8-TC). HIV-1 infection (percentage of Rev+) in each thymocyte subpopulation is presented. CEM cell expression of HIV-1 Rev proteins (49) was used as a positive control (not shown). HIV-1a and HIV-1b indicate two independent samples infected with NL4-3. Three independent experiments were performed with similar results

