
Fig 4.
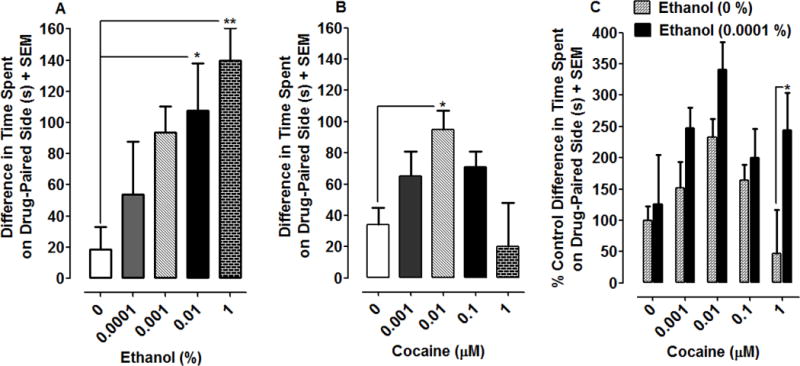
Ethanol and cocaine both produce EPC in planarians, and a combination of ethanol and cocaine produces enhanced EPC. Data are presented as the mean difference in time spent on the drug-paired side (s) + SEM for ethanol (4A) and cocaine (4B). N = 7–8 planarians per group. *P < 0.05 or **P < 0.01 compared to respective water controls. 4C) Data are presented as percentage of water control environmental shift (i.e., this environmental shift is the difference in time spent on the drug-paired side) + SEM. N = 7–8 planarians per group except for the water control (N=13). *P < 0.05 compared to group treated with cocaine by itself.