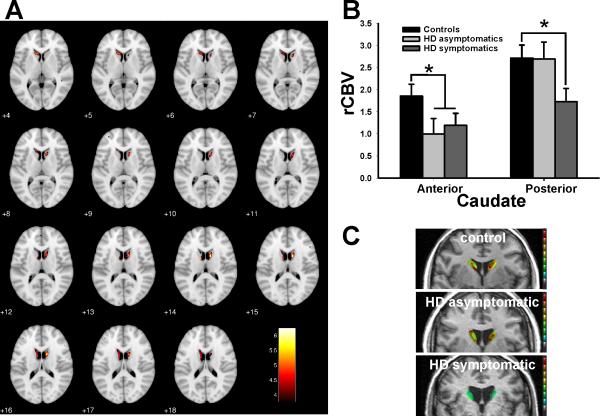
Figure 1. Mapping an anatomical phenotype of caudate dysfunction in HD.
(A) Voxel-based analysis of rCBV in whole brain maps comparing HD patients to controls reveals greatest rCBV decreases in the caudate.
(B) ROIs in the caudate reveals decreased rCBV in the anterior caudate in asymptomatic gene positive subjects (light gray) and HD patients (dark gray) compared to controls (black), while decreased rCBV in the posterior body of the caudate was found only in HD patients. Shown are normalized mean rCBV values and standard deviation (SD).
(C) Individual representative examples of rCBV maps in the posterior body of the caudate of a control subject (upper panel), an asymptomatic gene positive subject (middle panel), and a HD patient (lower panel).
* denotes p≤0.05. rCBV maps in A and C were color coded, such that warmer colors represent higher rCBV values.

