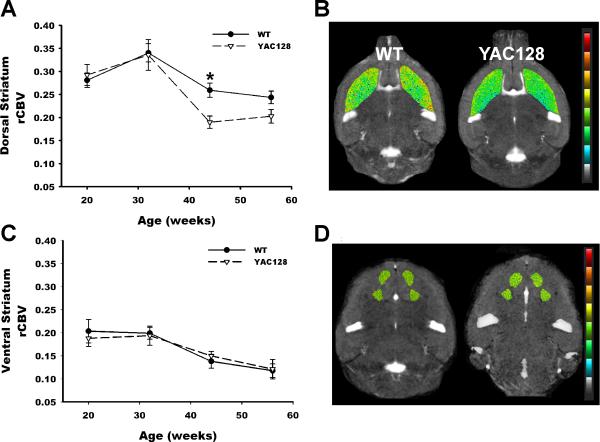
Figure 3. Age-dependent dorsal striatum dysfunction in the YAC128 mouse model.
(A) rCBV imaged longitudinally over time reveals an accelerated decline in rCBV in the dorsal striatum of YAC128 mice (broken line) compared to WT littermates (solid line). Shown are mean normalized ΔR2 values (see Methods) and SD vs. age in weeks.
(B) Representative rCBV pseudocolor maps of the dorsal striatum shown for a 44 week old YAC128 mouse and a WT littermate. Warmer colors represent higher rCBV values.
(C) rCBV imaged longitudinally over time reveals no difference in the ventral striatum of YAC128 mice (broken line) compared to WT littermates (solid line). Shown are mean normalized ΔR2 values and SD vs. age.
(D) Representative rCBV pseudocolor maps of the ventral striatum shown for a 44 week old YAC128 mouse and a WT littermate. Warmer colors represent higher rCBV values

