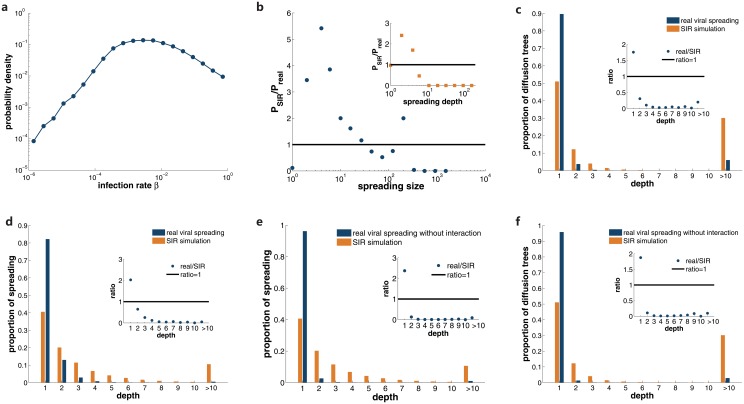
Fig 3. SIR modeling with users’ infection rate cannot reproduce the realistic viral spreading pattern.
a, distribution of the real-world infection rate for each individual β calculated from viral spreading instances. We display the ratio between the size distribution of SIR simulations and real viral spreading in b. Inset shows the ratio of depth distribution. In c, we present the proportion of diffusion trees with a given depth for both SIR simulations and real viral spreading, and show the ratio between real cases and SIR modeling in the inset. d presents the proportion of spreading instances for diffusion with a specific depth for both cases. The inset shows the ratio between real viral spreading and simulations. In e and f, we perform same analyses for viral spreading without interactions with other diffusion types.

