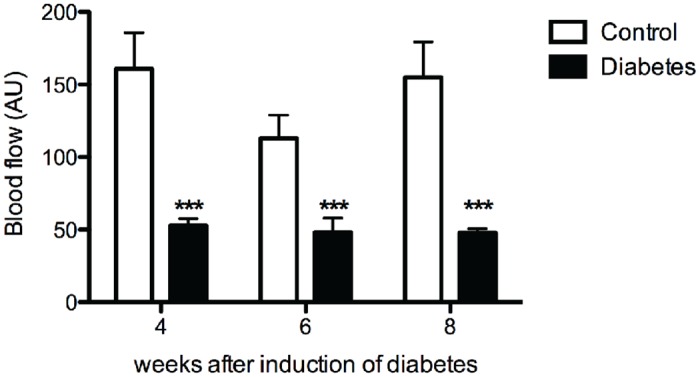
Fig 3. Decreased skin blood flow in diabetic animals.

Plantar skin blood flow was decreased in all diabetic animals (black bars) when compared to controls (white bars). Data is presented as mean ± SEM. *** p< 0.001 (two-way ANOVA with one repeated-measures factor ‘time’ with Bonferroni post-test).
