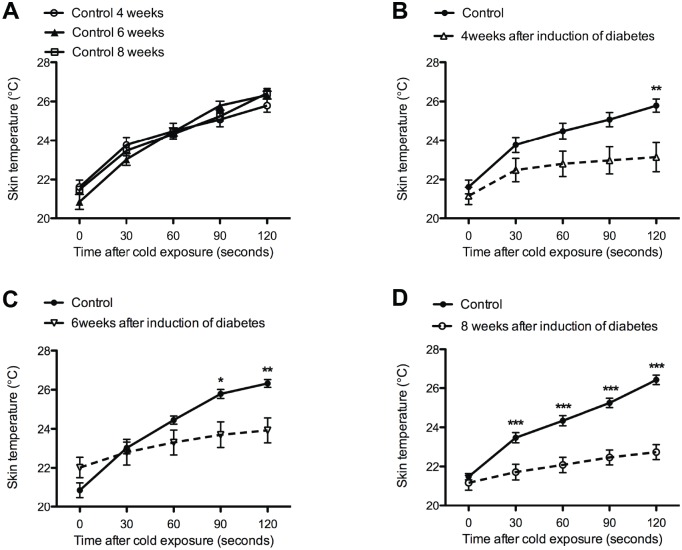
Fig 5. Decreased skin temperature of the plantar hind paw after cold exposure.
Control groups were not significantly different (A). Significant lower skin temperatures were observed in diabetic animals 4 (B), 6 (C), and 8 weeks (D) after the induction of diabetes (dotted line) when compared to controls (continuous line). Data is presented as mean ± SEM. *p < 0.05, **p <0.01, *** p< 0.001 (two-way ANOVA with one repeated-measures factor ‘time’ with Bonferroni post-test).

