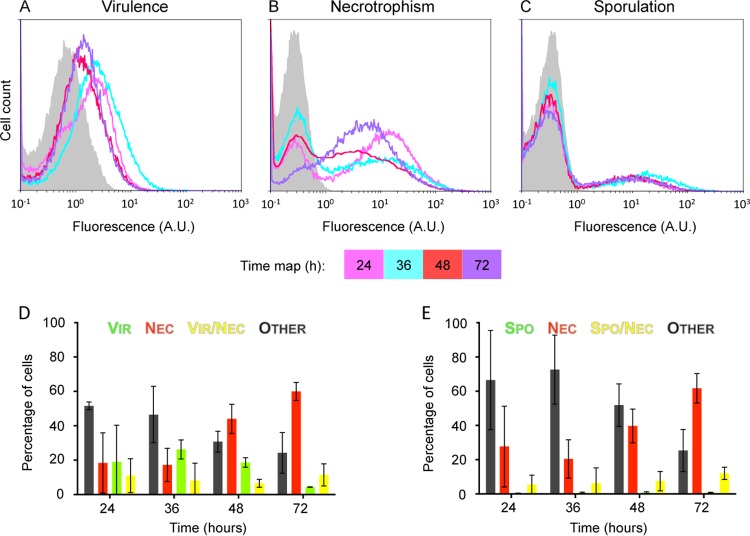
FIG 4.
plcB, nprA, and spoIID promoter activities in cells isolated from a biofilm grown in LBP. Shown are flow cytometric analyses of plcB-yfp (A)-, nprA-mCherry (B)-, and spoIID-yfp (C)-expressing Bt cells isolated from a biofilm grown in LBP at the air-liquid interface in glass tubes. Biofilms were allowed to develop at 30°C for 72 h, and samples were harvested at the time points indicated after LBP inoculation. Histograms are representative of at least three independent experiments. A.U., arbitrary units. Also shown are flow cytometric analyses of plcB-yfp nprA-mCherry (D)- and spoIID-yfp nprA-mCherry (E)-expressing Bt cells harvested at the time points indicated. For full descriptions of the histograms, graphs, and color code used, see the legend to Fig. 2. The results are mean values from three independent experiments (error bars show the standard deviation from the mean).

