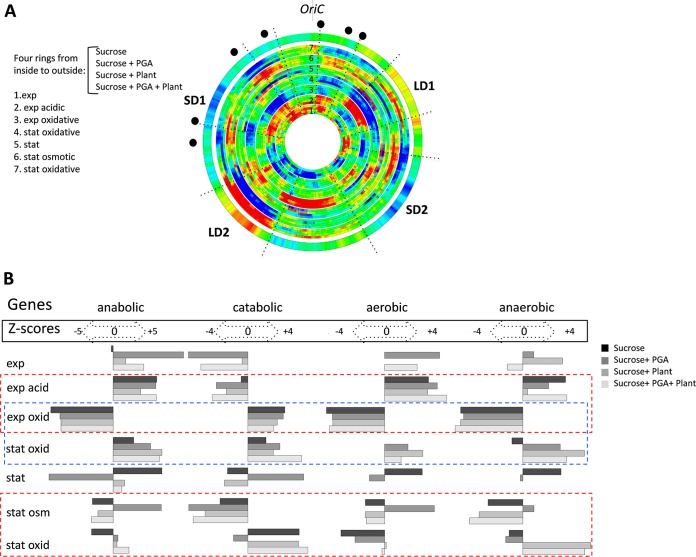
FIG 2 .
Spatial genomic wheels of the D. dadantii transcriptional response to stress. (A) Gene density distributions. The wheels corresponding to each single condition are arranged in bundles of four rings (due to the four different media used: sucrose, sucrose-polygalacturonate [i.e., PGA, a pectin derivative], sucrose-plant, and sucrose-plant-PGA). The conditions (listed on the left side of the panel) are ordered from inside to outside and numbered from 1 to 7. Each of the consecutive four-ring bundles in the wheel (from inside to outside) shows the change in the density of differentially expressed genes (red, high; blue, low) compared to the preceding condition. The different stress conditions are arranged according to their assumed occurrence during the infection. The first four-ring bundle (exp, exponential phase) is compared to the stationary-phase (stat) expression. Only the significant differentially expressed genes (P < 0.05; FC, >1.2) are compiled in this representation. The outer ring shows the averaged distributions of negative melting energy in the genome. Locations of rrn genes are marked by black dots. The colors in the rings (blue and red) indicate the significance of the change (Z scores of >3). (B) Distribution of the different functional groups of genes in the stress-response patterns. The conditions are indicated in the leftward column and arranged according to the wheels in panel A. The four remaining columns represent the significant changes in the anabolic, catabolic, aerobic, and anaerobic genes for each condition. The corresponding Z scores (both positive and negative) are indicated for each functional group. Positive and negative Z scores indicate the increase and decrease of each particular functional group in the corresponding pattern. Functional gene groups were taken from the respective GO branches provided by the KEGG database. The dashed rectangles indicate the comparisons between different stresses (red) and between different growth phases with oxidative stress (blue).

