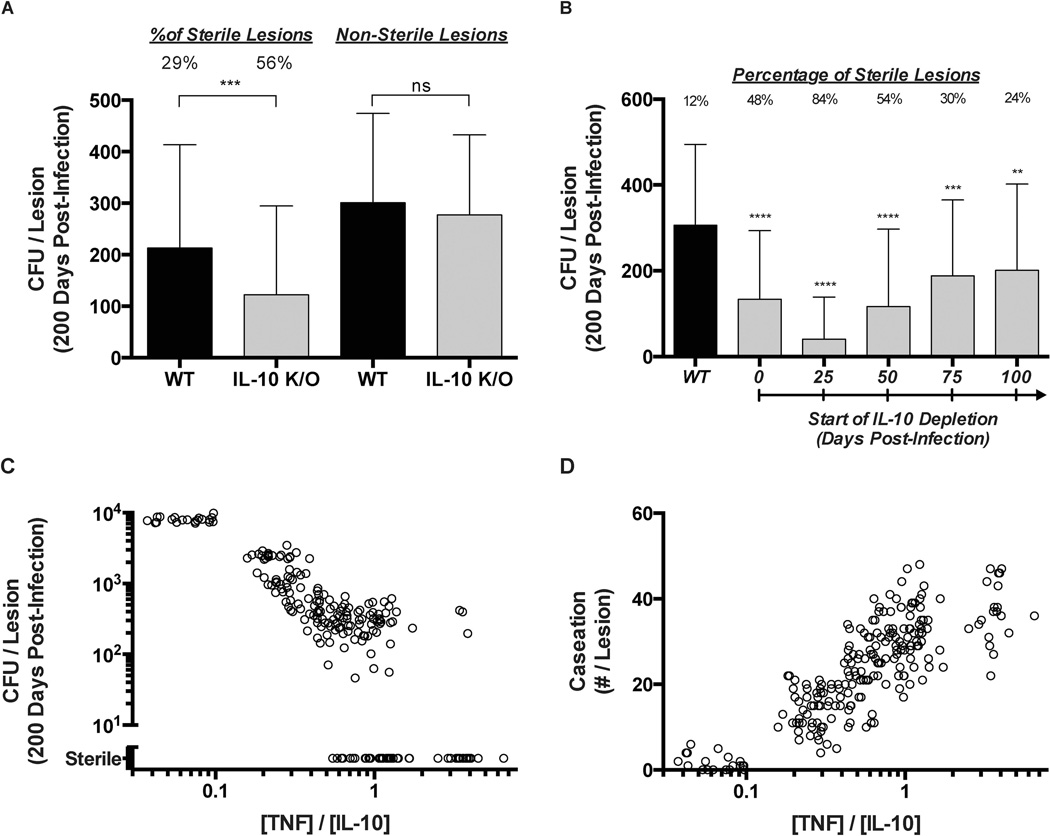
Figure 5.
Simulated immunomodulation of IL-10 and TNF in granulomas. (A) Left side: Mean CFU per lesion for WT and IL-10 deletion (IL-10 K/O) lesions at 200 days post-infection. Percent of lesions becoming sterile by 200 days is indicated. Right side: Mean CFU per lesion for WT and IL-10 deletion (IL-10 K/O) lesions that were non-sterile at 200 days post-infection. Error bars indicate SD. (B) CFU for WT and IL-10 deletions starting at day 25, 50, 75, or 100 days post-infection. Percent of lesions becoming sterile by 200 days is indicated. Error bars indicate SD. (C) CFU per lesion and (D) Number of caseated compartments per lesion for granulomas with differing ratios of mean TNF to IL-10 concentrations. The ratio of TNF to IL-10 was modulated by increasing/decreasing rates of TNF and/or IL-10 production from all cell types. Individual circles represent individual lesions.

