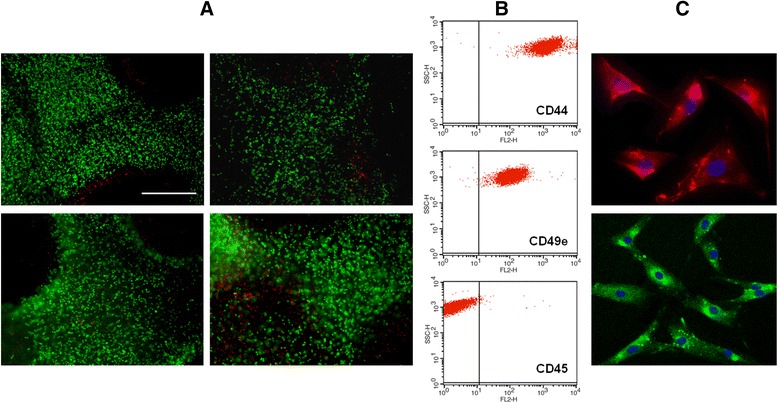
Fig. 5.

Cells within the CVOCA are viable, functional chondrocytes. (A) Representative images of live/dead staining in a transverse section taken from the top (superficial zone) of CVOCAs from four different donors. Live cells are stained green, and dead cells are stained red. The scale bar represents 500 μm. (B) Representative FACS dot plots for the cell population isolated from the CVOCA. The vertical lines on the graphs represent a cut off point for negatively (left side) and positively (right side) stained cells. The population is positive for the chondrocyte markers CD44 and CD49e and negative for the hematopoietic cell marker CD45. (C) Immunofluorescent staining of cultured cells that were isolated from the CVOCA. Cells were stained for nuclei (blue, both images), type II collagen (red, top image), and aggrecan (green, bottom image)
