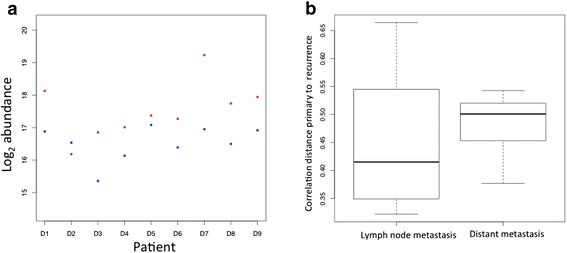
Figure 2.

A paired analysis approach using tumours from the same patient was used. (a) An example of the paired analysis showing the protein levels. Log2 abundance of P16284, platelet endothelial cell adhesion molecule, for primary tumour (blue dots) and distant metastasis (red dots). (b). A box plot representation of the correlation distance between paired tumours; primary-lymph node metastasis and primary-distant metastasis.
