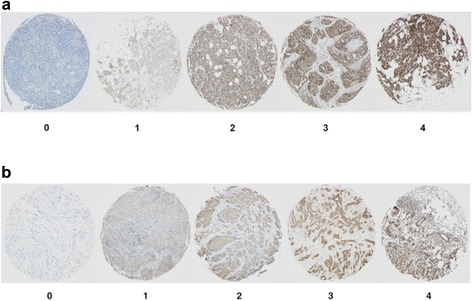
Figure 6.

This show representative images of intensity grading levels. Tissue cores are 1.0 mm and the images were taken with 40× magnification. a) Staining of ATPase Inhibitory Factor 1 levels 0–4 b) IHC staining of tubulin β-chain intensity levels 0–4.
