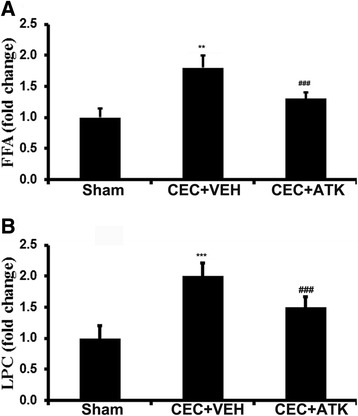
Figure 4.

Effect of ATK on CEC-induced increased levels of FFA and LPC in the spinal cord tissue from epicenter region 24 h after CEC. Levels of FFA (A) and LPC (B) were measured by HPTLC. Data are expressed as means ± SD (n = 5). **p < 0.01, ***p < 0.001 vs. Sham and CEC + ATK, ###p < 0.001 vs. Sham.
