Figure 6.

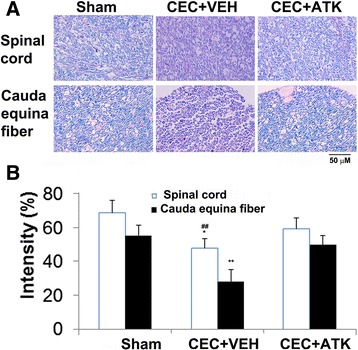
Effect of ATK on CEC-induced changes in LFB histochemistry of the spinal cord tissue from epicenter region (upper panel) and CE fibers (lower panel) 14 days after CEC. Myelin levels in both the spinal cord and CE fibers were significantly reduced in CEC + VEH group compared to sham and CEC + ATK groups (A). Corresponding quantification of LFB staining intensity was given in (B). Photomicrographs are representative of n = 5 in each group. *p < 0.05 vs. CEC + ATK, ##p < 0.01 vs. Sham, **p < 0.01 vs. Sham and CEC + ATK.
