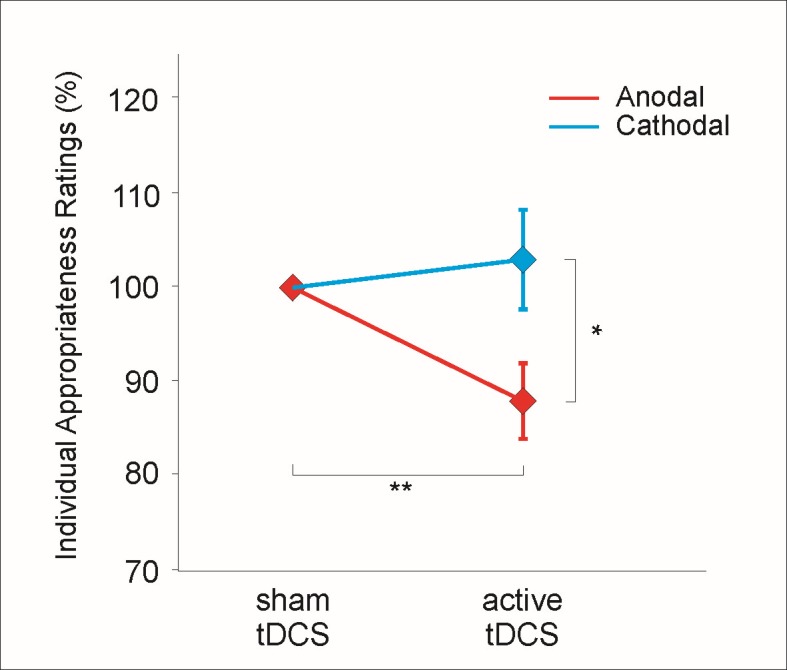
Fig 1. Performance data.

Individual Appropriateness Ratings for anodal tDCS and cathodal tDCS over the left DLPFC. There is a decrease in individual appropriateness ratings from sham to active stimulation in the subjects that received anodal tDCS (red line) but not in the subjects that received cathodal tDCS (blue line). Data are normalized to the value during sham stimulation. Asterisks indicate statistical significance. Data are the means +/- SEM.
