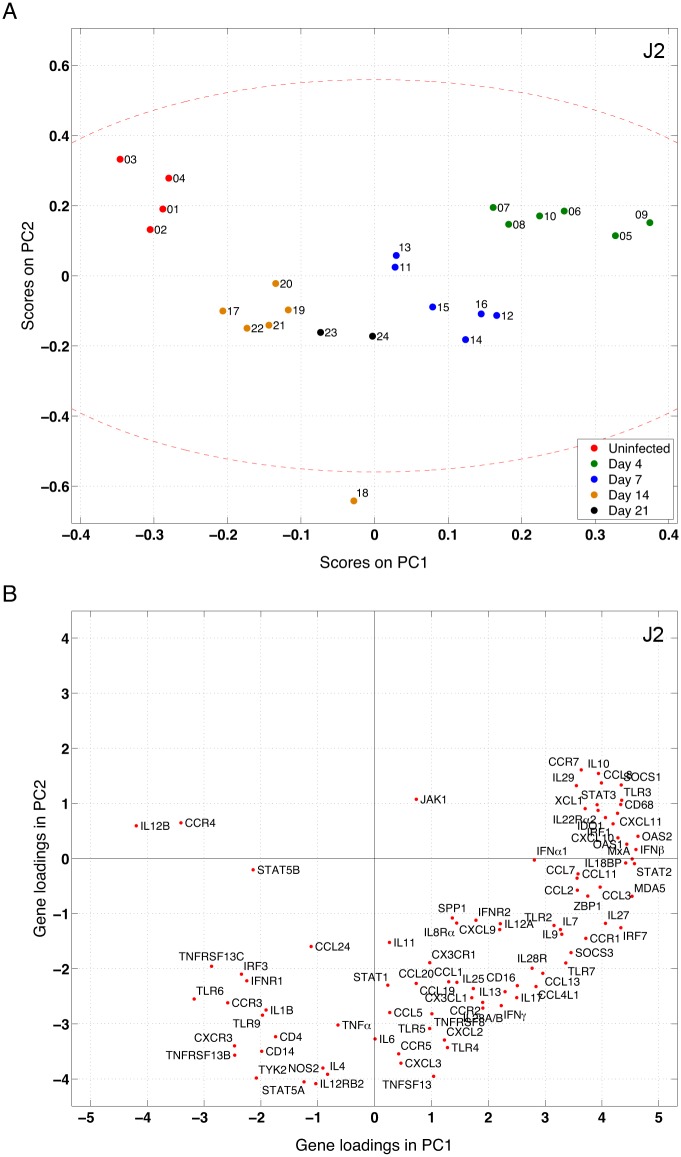
Fig 2. Multivariate gene expression is predictive of output variables: score and loading plots for the spleen dataset analyzed by judge 2—J2: (Orig, UV, PCA).
(A) Score plot; each dot represents an observation (animal), projected onto PC1 and PC2. Although the PCA method is given no information on the time since infection, clearly animals cluster with their time points. The red dashed ellipse determines the 95% confidence interval, which is drawn using Hotelling's T2 statistic. (B) Gene loadings (weights) for the top two PCs. Genes that are highly loaded on PC1 and PC2 (i.e. far from the origin) contribute more to the scores in the score plot than other genes. Genes located in the same direction are highly correlated. The results for other judges testing the spleen dataset are shown in S3 Information (score plots) and Fig 3 (loading plots).

