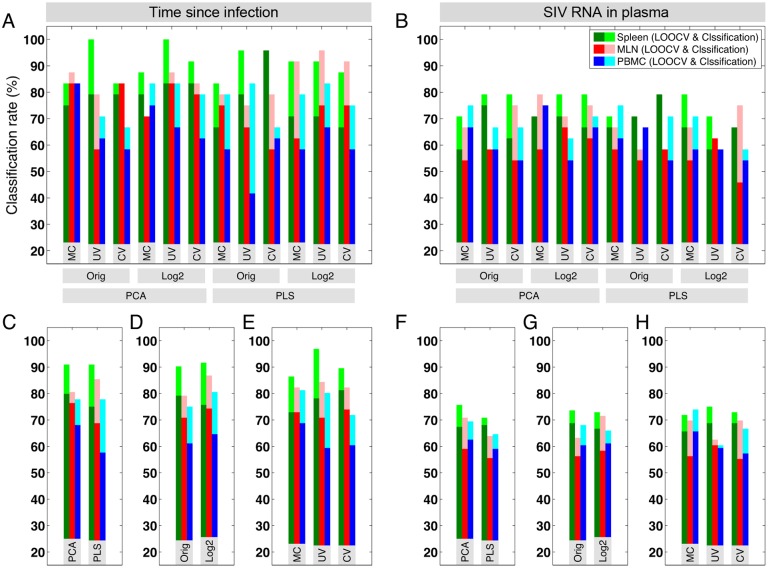
Fig 4. Classification and cross validation in all datasets and for both classification schemes.
The classification and LOOCV rates for the top classifier PCs are shown for each judge for classifications based on (A) time since infection and (B) SIV RNA in plasma. Light and dark colors represent the classification and the LOOCV rates, respectively. (C-H) The average classification and LOOCV rates are also shown for judges using a common feature, i.e. Orig vs. Log2, MC vs. UV vs. CV, and PCA vs. PLS. In general, we observe that clustering based on SIV RNA in plasma is less accurate and less robust than the classification based on time since infection.

