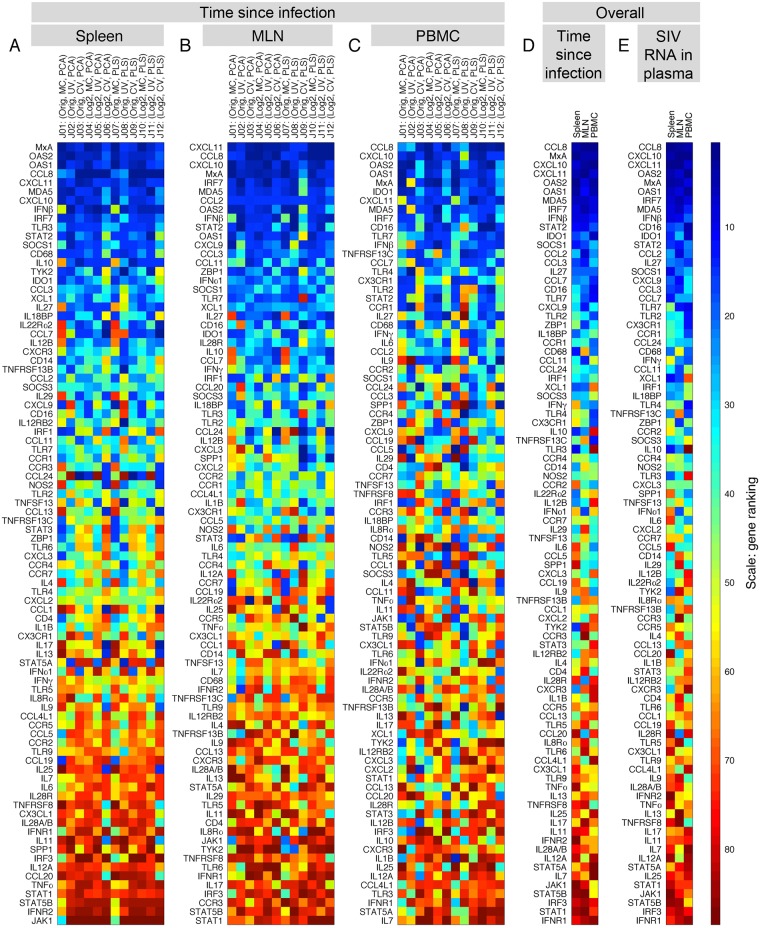
Fig 5. Identification of tissue-specific and global genes: gene rankings across judges and datasets (tissues).
The highly loaded genes contribute more to the scores that are used for classification, and hence are considered as the top “contributing” genes. To study genes based on their contribution, we calculate the distance of each gene from the origin in the loading plots and rank the distance values in a descending order with the highest rank equivalent to the maximum distance, i.e. the highest contribution. For a given dataset, each gene is assigned a rank (highest ≡ 1; lowest ≡ 88) from each judge, resulting in a total of 12 ranks for each gene. Then, we calculate the average of twelve ranks for each gene and sort the results from the high-ranking genes (dark blue) to the low-ranking genes (dark red) in the (A) spleen, (B) MLN and (C) PBMC datasets. This leads to an overall rank for each gene in each of the datasets. (D) We calculate the average value of the three overall ranks and sort the results in a descending order of contribution. We observe that CCL8, followed by MxA, CXCL10, CXCL11, OAS2, and OAS1 are ranked as the top contributing genes in all datasets. S4 Information shows the equivalent results for SIV RNA in plasma as the classifier.

