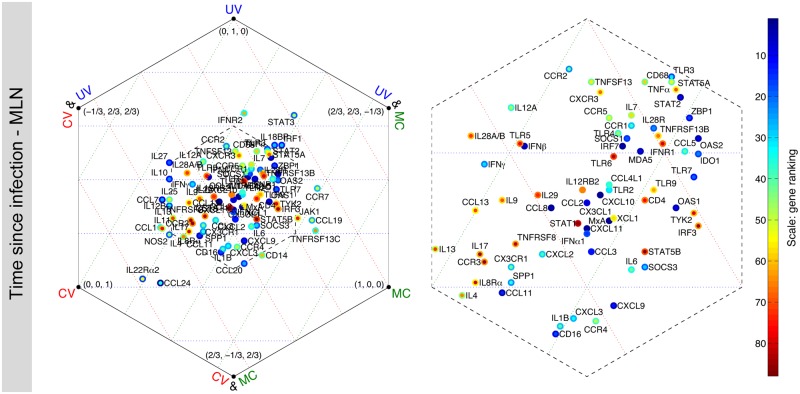
Fig 6. Judge-specificity of genes: relative importance of each gene using each normalization method, for time since infection in the MLN dataset.
In each hexagonal plot, three main vertices represent MC-, UV-, and CV-based judges. Genes close to one of these vertices are relatively more important to that class of judge. Three auxiliary vertices denote CV&UV, CV&MC, and UV&MC. For example, genes that are close to CV&MC have equal importance to both CV- and MC-based judges. Genes at the center have approximately similar importance to each class of the judges. The coordinates are formatted as the relative gene importance, C UV, C MC, C CV, taking values in the range [-1/3, 1] and satisfy C UV + C MC + C CV = 1 (see S6 Method for further explanation of coordinates). The inner color of each dot represents the average of the three ranks given by each class of the judges (obtained from Fig 5B), whereas the outer color represents the minimum (best) of the three ranks. The congested regions in the center of the left hexagonal plots are shown in greater detail on the right. Results for all tissues and classification schemes are shown in S13 Information.

