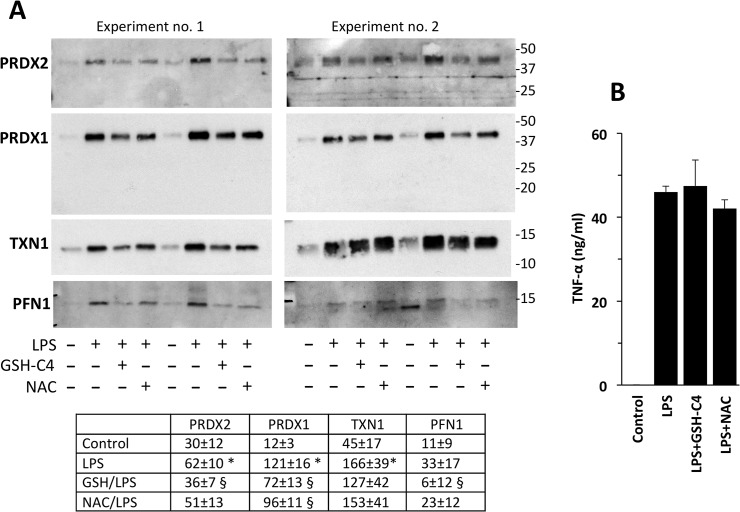
Fig 7. LPS-induced protein release is down-regulated by thiol compounds.
Cells were pre-treated with 10 mM GSH-C4 or NAC for 2 h, washed and then LPS was added for 24 h. A. Supernatants were run under non-reducing conditions after blockade with NEM. Data for the densitometric analysis are expressed as arbitrary units and are the mean ± SE (n = 4). * P<0.05 vs. control, § P<0.05 vs. LPS alone by Student’s t-test for paired data. B. TNF-α levels as measured by ELISA. Data are mean ± SE from three independent samples.

