
Fig 4. Pan-STAT3 primer quantification was compared to the summation of the four splice variants.
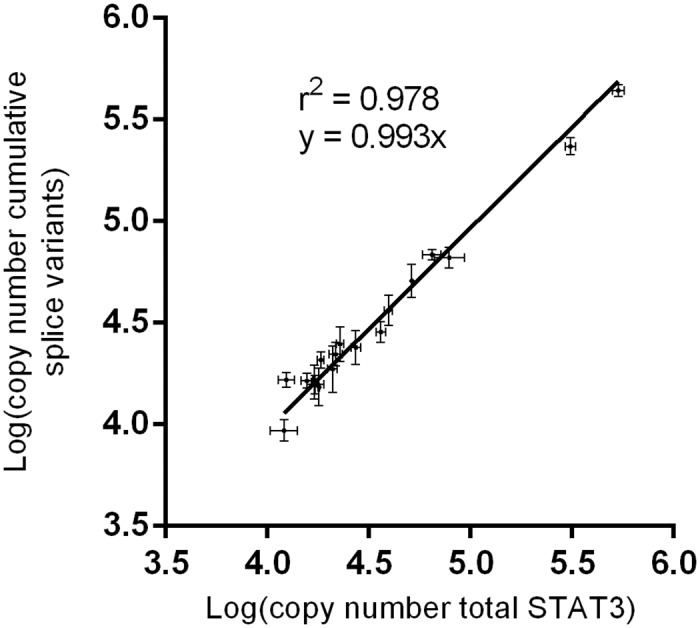
Quantification was performed for 18 eosinophil or DLBCL samples to validate the absolute qPCR protocol. Each point is plotted with its CV and represents the average of three replicates.