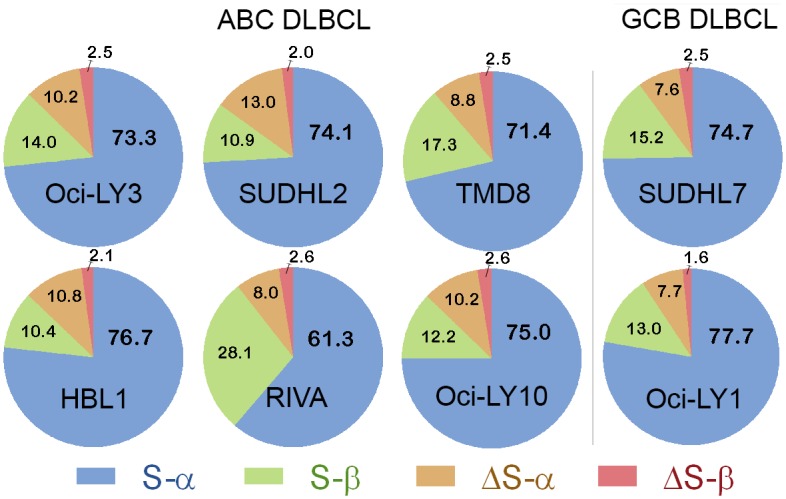
Fig 6. Pie charts of STAT3 splice variants in DLBCL.

Splice variant ratios in DLBCL differ minimally, except for RIVA. Absolute quantification qPCR was used to determine proportions of STAT3 splice variants in each cell line. Percentages of each splice variant are shown. Six samples are activated B cell DLBCL and two are germinal center B cell-like DLBCL. Data represent averages determined from at least three assays for duplicate reactions.
