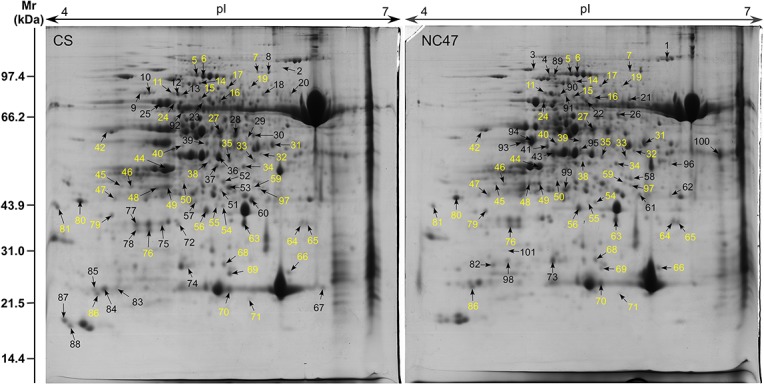
Fig 2. Proteome maps of two spring wheat varieties.

(A) CS under the control condition. (B) NC47 under the control condition. The numbered protein spots were identified by MALDI-TOF/TOF, and yellow numbers represent the common DAP spots in NC47 and CS.
