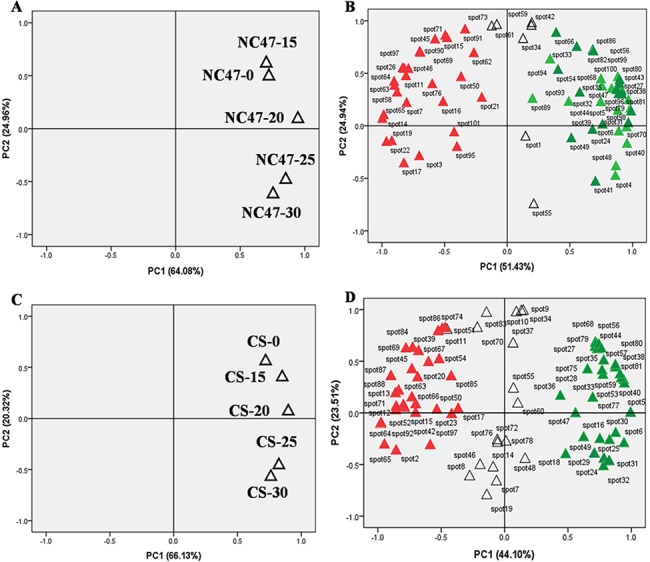
Fig 4. Principal components analysis (PCA) of the set of 101 DAP spots in NC47 and CS.

(A) PCA of individual experimental samples in NC47. (B) PCA of 69 differentially accumulated protein spots in NC47. (C) PCA of individual experimental samples in CS. (D) PCA of 77 differentially accumulated protein spots in CS. Red spots indicate an upregulated protein; green spots indicate a downregulated protein. CS-0, CS-15, CS-20, CS-25 and CS-30 represent the 0, 15%, 20%, 25% and 30%, respectively, of the PEG6000 concentration treatment in CS. NC47-0, NC47-15, NC47-20, NC47-25 and NC47-30 represent the 0, 15%, 20%, 25% and 30%, respectively, of the PEG6000 concentration treatment in NC47.
