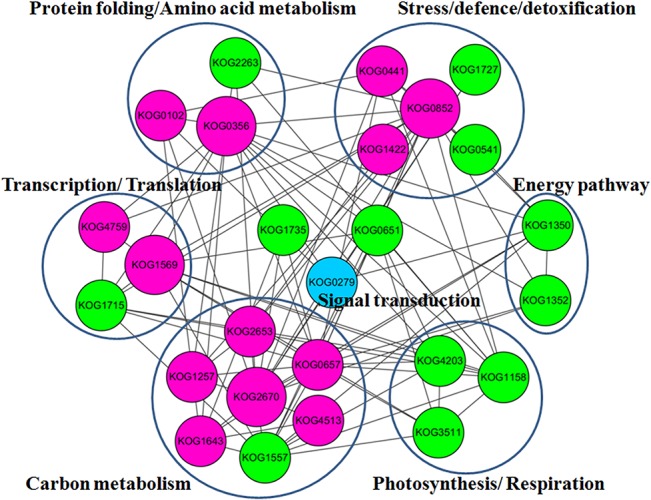
Fig 6. Network of key DAPs in NC47 involved in drought adaptation and tolerance.

Interactions of the DAPs are extracted by searching the STRING database with a confidence cutoff of 0.700. The interaction network is reconstructed using the Cytoscape software. Red colour represents the upregulated proteins and green colour shows the downregulated proteins in NC47 under high PEG6000 concentration stress. Blue colour indicates the signal transduction-related protein.
