
Figure 1:
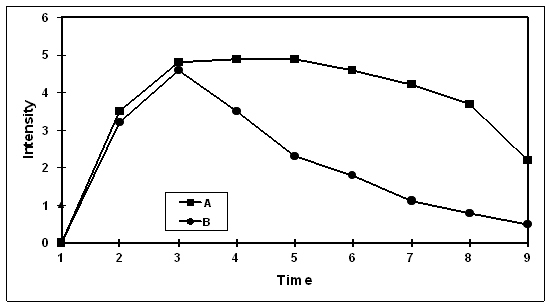
Hypothetical curves showing reactivity and recovery for two individuals, with each person showing comparable amplitude of response but with person B recovering more quickly than person A.
Official websites use .gov
A
.gov website belongs to an official
government organization in the United States.
Secure .gov websites use HTTPS
A lock (
) or https:// means you've safely
connected to the .gov website. Share sensitive
information only on official, secure websites.
Hypothetical curves showing reactivity and recovery for two individuals, with each person showing comparable amplitude of response but with person B recovering more quickly than person A.