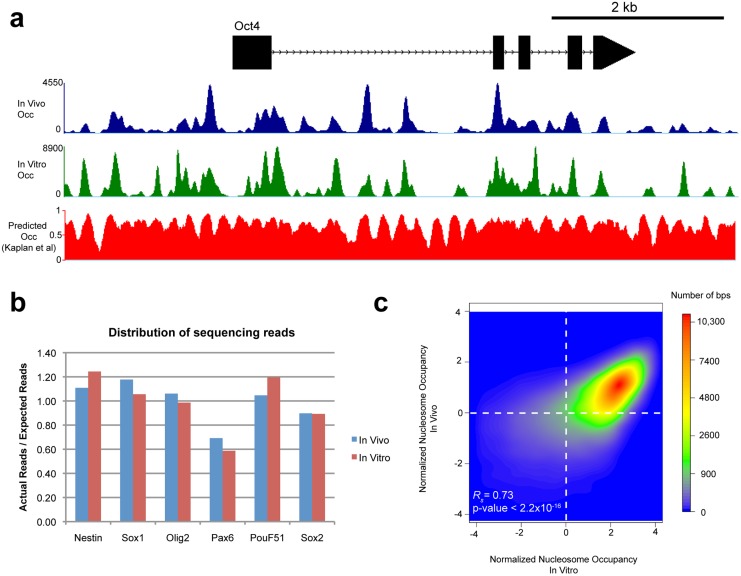
Fig 2. BEM-seq generated nucleosome occupancies are reproducible and reveal correlation between In vivo and in vitro occupancy.
(a) Tracks of nucleosome occupancy are displayed across the Pou51f (Oct4) gene. In vivo nucleosome occupancy is represented in blue, and in vitro nucleosome occupancy is represented in green. Occupancy is center-weighted but not normalized, representing the amount of sequencing reads present in the experiment. Predicted in vitro occupancy, calculated as described in Kaplan et al, is also shown. Predicted in vitro data is uniformly weighted and displays the probability of in vitro nucleosome occupancy for a given bp from 0 to 1. (b) The sequence read coverage of each BAC is shown. The percentage of on target reads is calculated by taking the actual number of reads per BAC and dividing by the expected number of reads per BAC (The number of total sequencing reads multiplied by the ratio of the BAC length in bp to the total experiment size). Each BAC shows similar levels of enrichment from in vivo and in vitro experiments. (c) A density scatter dot plot of in vivo versus in vitro normalized occupancy scores is shown. For each sample, the log2 of the normalized occupancy is taken, and the genome average is subtracted to set the average plotted value to zero. In vivo and in vitro nucleosome occupancy tightly correlate with each other. Spearman-rank correlation analysis for all base pairs in the datasets confirms the similarity between the two datasets (0.73, p <2.2x10¹⁶). This reflects the influence of intrinsic nucleosome preferences on in vivo occupancy.

