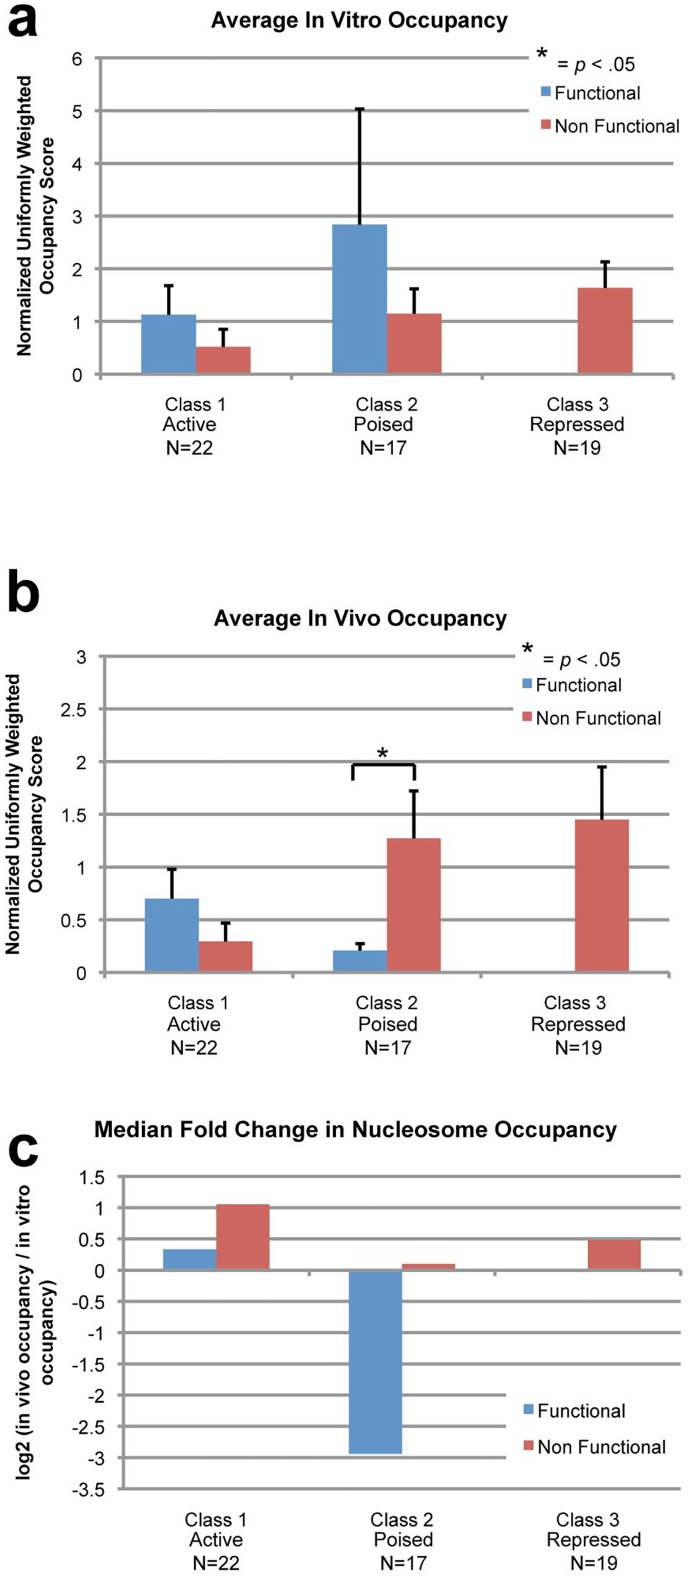
Fig 4. Correlations between functional transcription factor binding and nucleosome occupancies.
Using the average transcription factor (TF) occupancy (Oct4 and Sox2, from Whyte et al.) across the 15bp predicted binding sites for Oct4 and Sox2 (n = 58), we identified each site as functional or nonfunctional using a TF occupancy score of > = 20 as a cutoff. We also separated each set of factors by the type of downstream gene regulation (Class 1 Active: functional (n = 10) and nonfunctional (n = 12), Class 2 Poised: functional (n = 4) and nonfunctional (n = 13), Class 3 Repressed: nonfunctional (n = 19)). We calculated the in vitro and in vivo occupancy over the 15bp of each binding site and found the average of each gene type and binding site type. We also calculated the log2 of the ratio of in vivo to in vitro occupancy at each binding site and found the median for each gene and site type. The standard error of the mean is displayed in the error bars. Paired Z-scores between different classes were calculated and p-values < 0.05 are marked with an asterisk. (a) In vitro occupancy is not significantly different at functional versus nonfunctional sites for both class 1 and class 2 genes. (b) At class 1 genes, in vivo occupancy is not significantly different at functional TFBS. At class 2 genes however, in vivo occupancy is significantly lower at functional TFBS. (c) For class 1 genes’ functional sites, the median fold-change is small and positive, while at class 2 the median fold-change is large and negative. Nonfunctional sites across all gene classes were positive.

