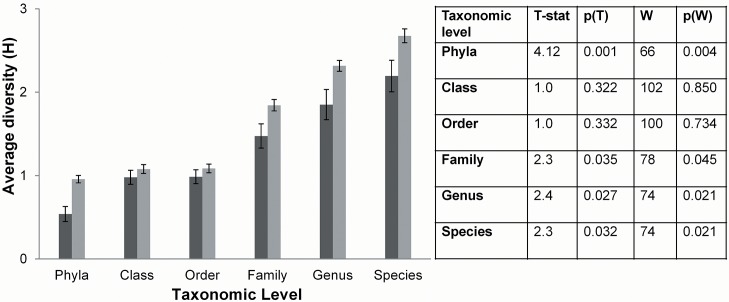
Fig 3. Average diversity between diet types using the Shannon-Weaver diversity index (H) for all taxonomic levels.
Diversity statistics: T-test: df = 13 for phyla (unequal variance) and df = 18 for all other taxonomic levels; Manny-Whitney U test: df = 1. p(t) is P-value of the t-test, p(W) is P-value of the Mann-Whitney U test. Error bars display the standard error of mean.

