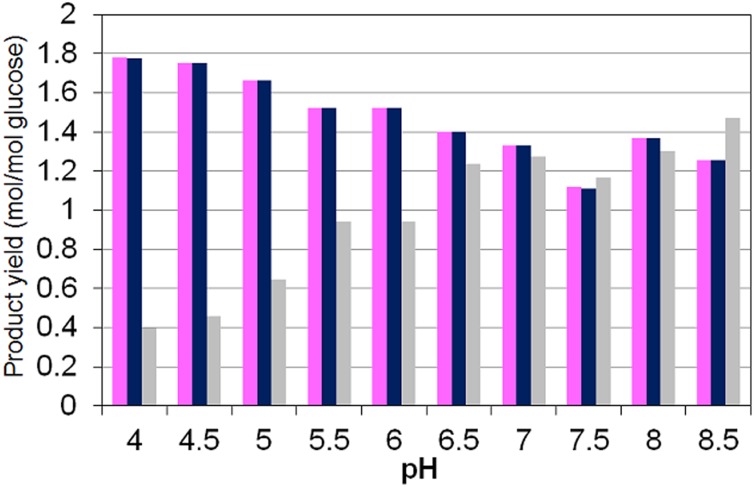
Fig 7. Model simulation results on the influence of pH on acetyl-CoA derivatives, H2 plus formate and biomass yields per glucose consumed.
Yields of: (pink) Total acetyl—CoA derivatives as sum of acetate, acetoacetate, butyrate (x2), butanol (x2), butyraldehide (x2), ethanol and acetaldehyde yields; (navy blue) sum of H2 and formate yields and (grey) biomass yield. (Compared to the experimental results presented in Fig 5b).

