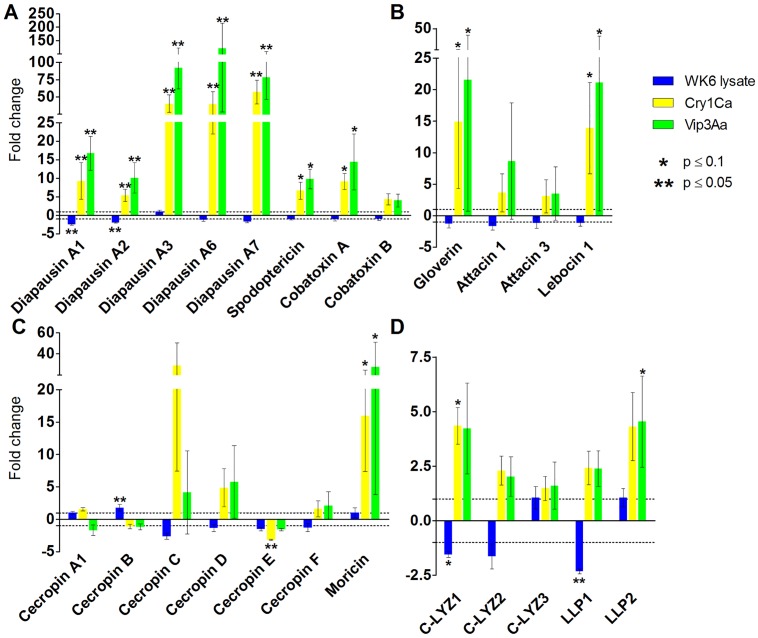
Fig 5. AMP and lysozyme transcript levels in S. exigua larval midgut after challenging with Bt toxins.
Gene expression of each transcript after the different treatments (WK6 lysate, Cry1Ca, and Vip3Aa) was compared to its control (used as calibrator). Fold-changes were determined by using the REST MCS software. Each bar represents the mean of three independent experiments (± SEM). Dotted lines indicate 1 and -1 fold-changes. A) Cysteine-rich peptides; B) glycine- and proline-rich peptides; C) amphipathic peptides; D) lysozymes.

