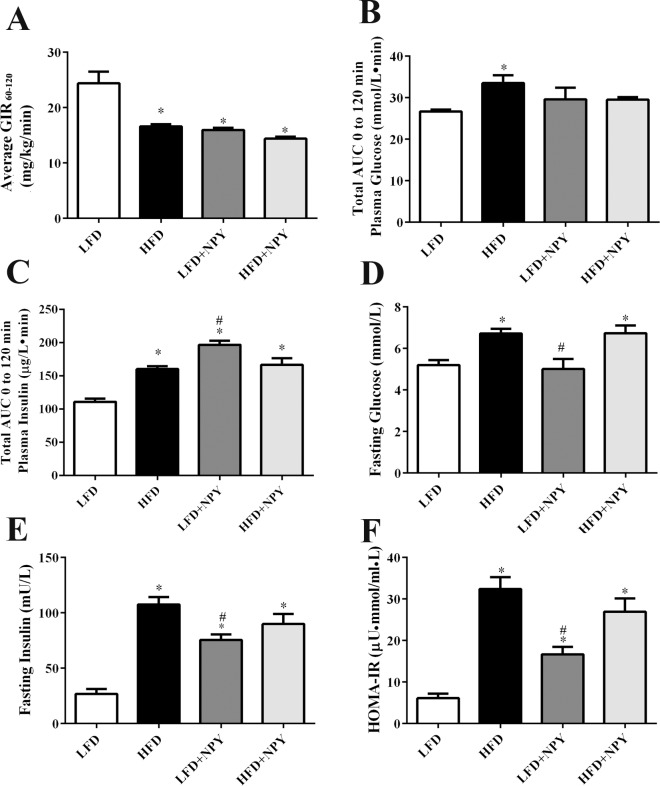
Fig 2. Overexpression of NPY contributes to insulin resistance in rats.
Eight weeks after dietary and lentiviral intervention, insulin resistance was evaluated. (A) Average glucose infusion rate (GIR60-120) of the four groups (LFD, HFD, LFD+NPY, HFD+NPY) in euglycemic-hyperinsulinemic clamps (n = 3). (B) Total area under curve (AUC) of plasma glucose and (C) total area under curve (AUC) of plasma insulin during a 120 min intravenous glucose tolerance test (IVGTT) in the four groups (n = 4). (D) Fasting blood glucose, (E) fasting plasma insulin, and (F) homeostasis model-insulin resistance (HOMA-IR) (n = 8), in the four groups. HOMA-IR was calculated according to the formula: fasting insulin (μU/mL) × fasting glucose (mM) / 22.5. Data are presented as means ± SEM, *P<0.5 vs. LFD; # P<0.5 vs. HFD.

