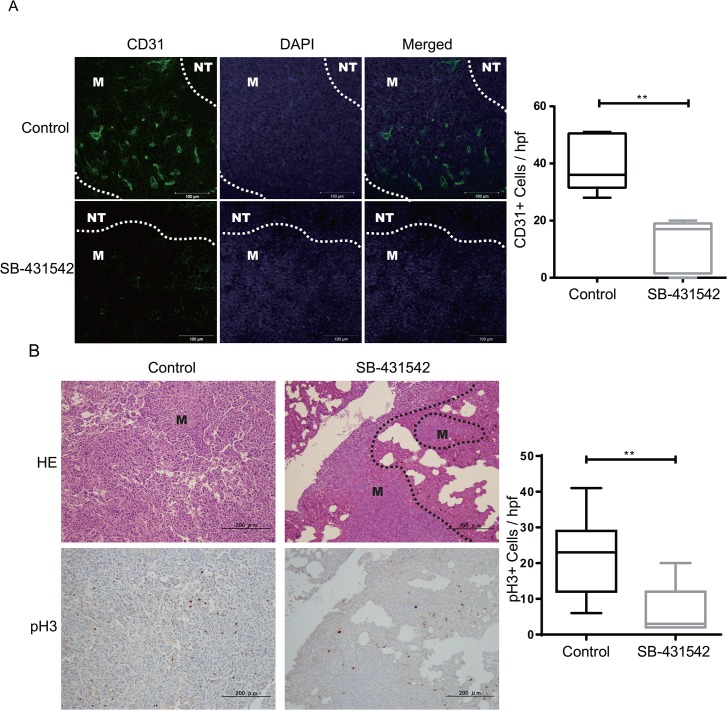
Fig 2. SB-431542 treatment inhibits the angiogenesis and proliferation of metastasized tumors.
(A) Representative images of metastasized tumors with CD31 (green) and DAPI (blue) staining per vessel density. Scale bars represent 100 μm. White dotted lines demarcate metastases (M) and normal lung tissue (NT). (B) CD31 immunostaining was captured using a Zeiss microscope, and the number of positive cells was counted. The Box blot represents the number of positive cells/field. The results are shown as the upper and lower quartiles and the mean, and the whiskers show the maximum and minimum values; there are 3 tumors/group. Black dotted lines demarcate metastases (M) and normal lung tissue. (C) Paraffin-fixed sections were assessed by H&E staining (top panel) and were stained for proliferation using phospho-Histone H3 (pH3) antibody (bottom panel). (D) The number of pH3-positive cells was counted and plotted as shown to obtain a statistical value. The mean number of pH3-positive cells ± SEM for 3 tumors/group is shown, ** p<.0.001 with unpaired t-test; hpf, high power field.

