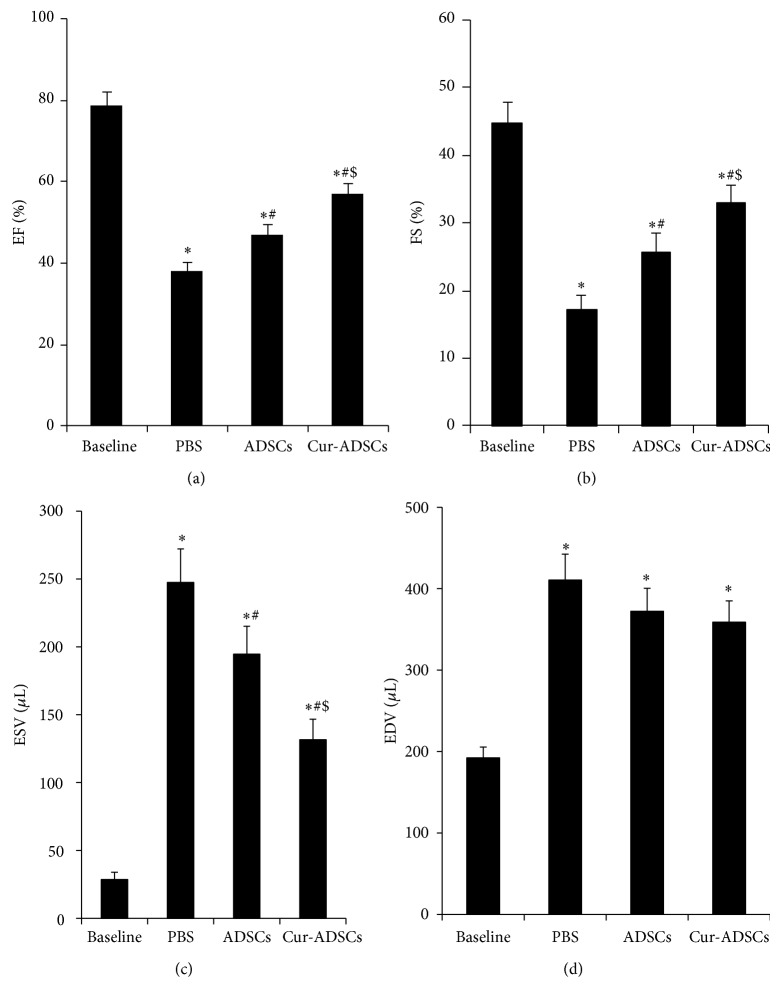
Figure 4.
Echocardiographic assessment of cardiac function. ((a)-(b)) EF and FS were highest in the Cur-ADSCs group compared with PBS control and ADSCs groups (P < 0.05). (c) ESV was significantly improved in the Cur-ADSCs group compared with PBS control and ADSCs groups (P < 0.05). (d) There is no significant difference for EDV among PBS, ADSCs, and Cur-ADSCs groups. Statistical differences (P < 0.05) are indicated from the baseline (∗), PBS (#), and ADSCs ($).

