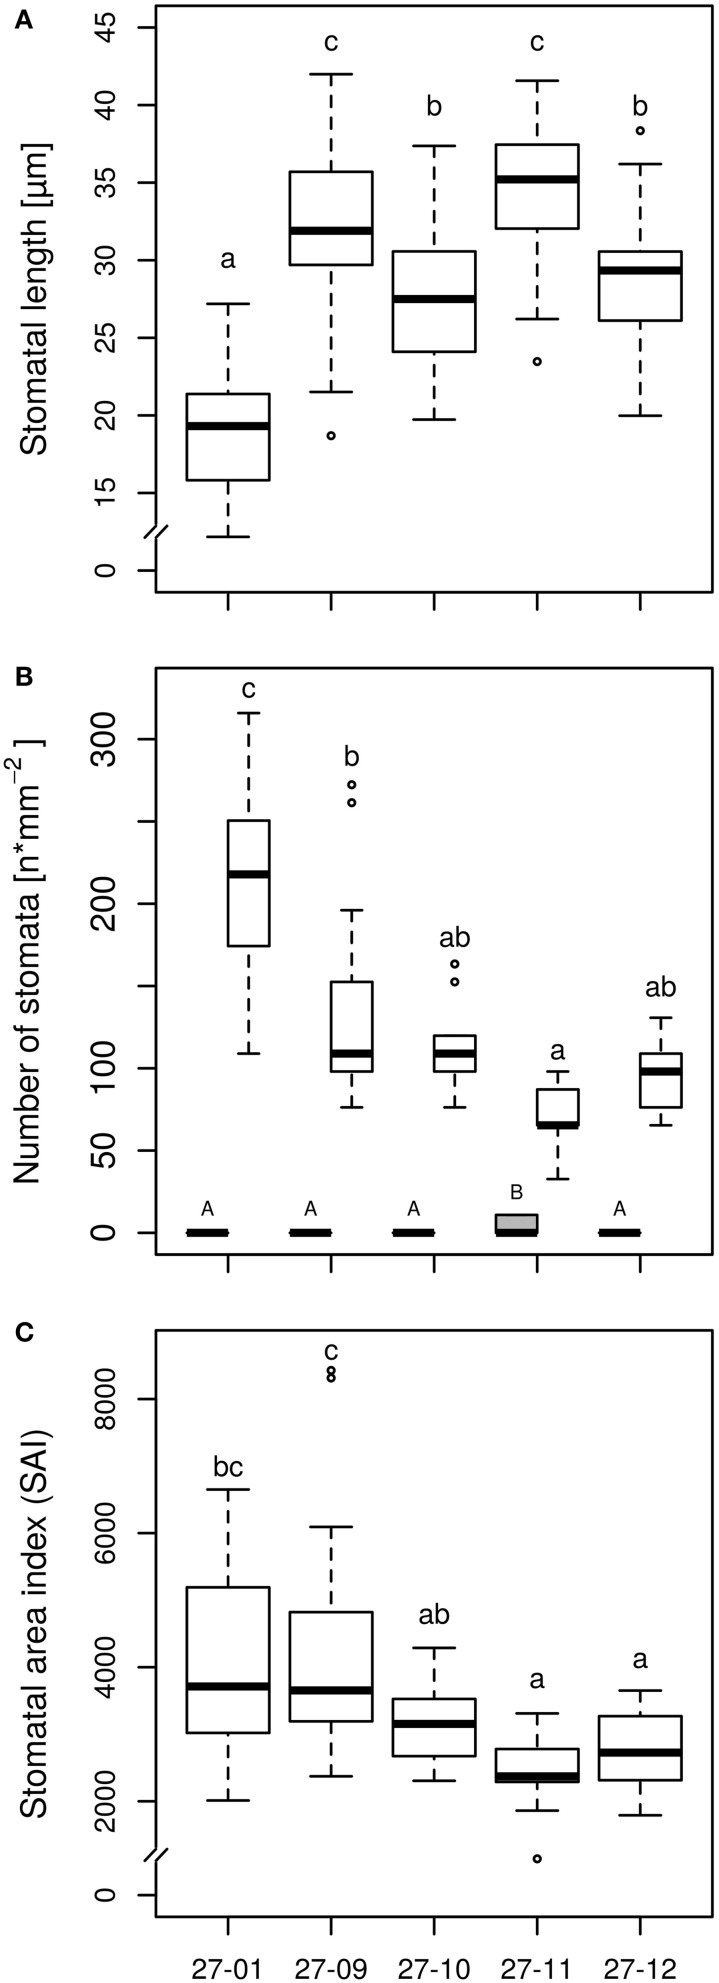
Figure 3.
(A) Stomatal length on abaxial surface, (B) Stomatal density on adaxial and abaxial surface, and (C) Stomatal area index (SAI) on abaxial surface [samples were taken of the upper fifth fully expanded leaf of the diploid line and the tetraploid fusion lines before starting the experiment, stomatal length: n = 45 stomata per line, stomatal density: n = 15 leaf sections per line and leaf side (gray box, adaxial side; white boxes, abaxial side), SAI: mean stomatal length of three stomata of one leaf section multiplied by stomatal density of this leaf section, n = 15 leaf sections per line; 27-01: diploid, other lines: tetraploid. Boxplot definition: Outer transversal bars of the boxplots include 95% of the data, 50% of the data are defined by the boxes themselves, the median is shown by the highlighted line within the box. Outliers are represented by open circles. Different letters at the top of the boxes indicate significant differences between the lines (TukeyHSD test, p < 0.05). Capitals are used for the adaxial side, lowercase letters for the abaxial side].

